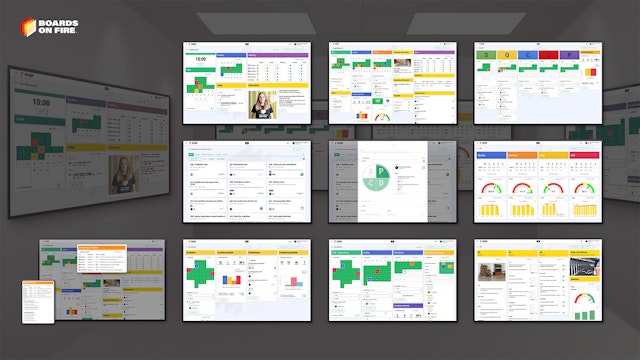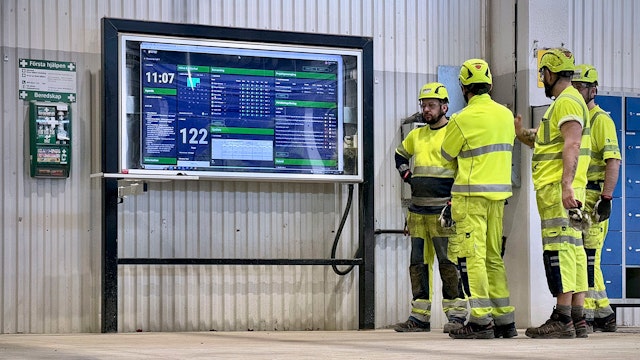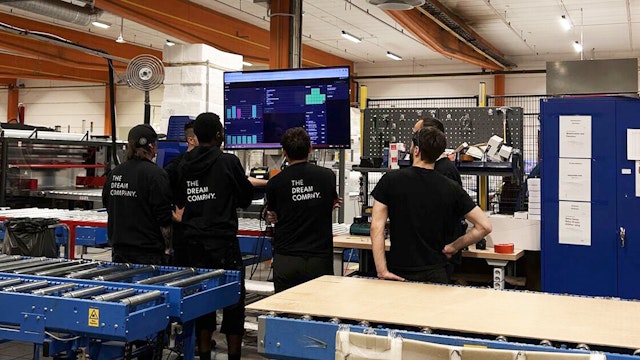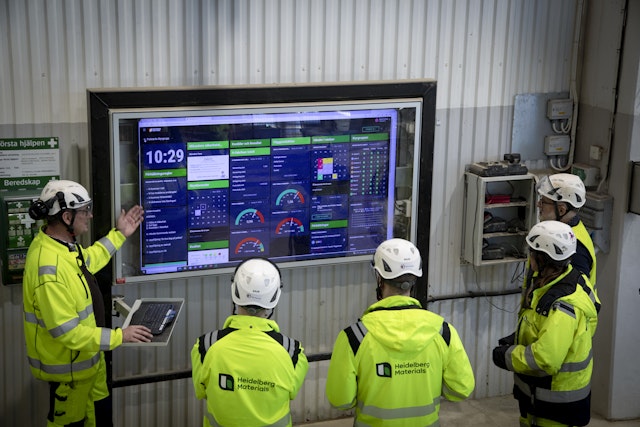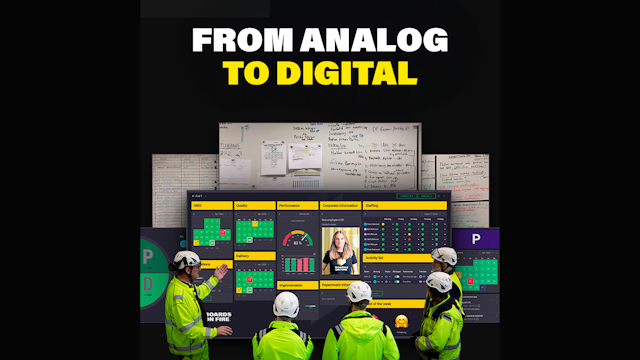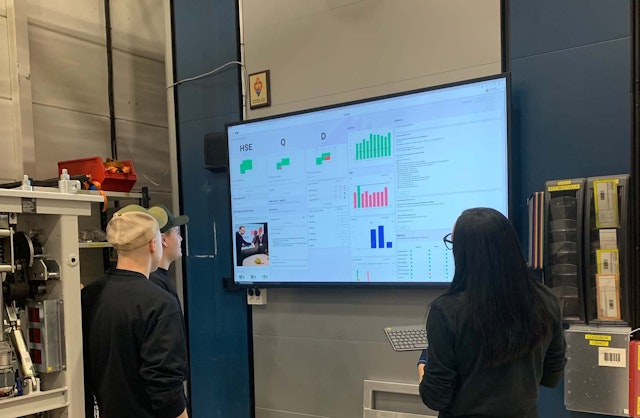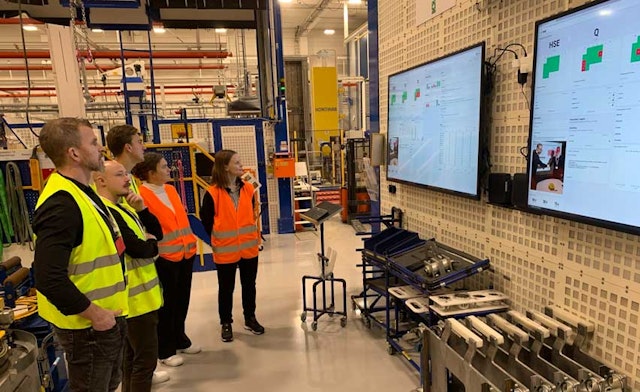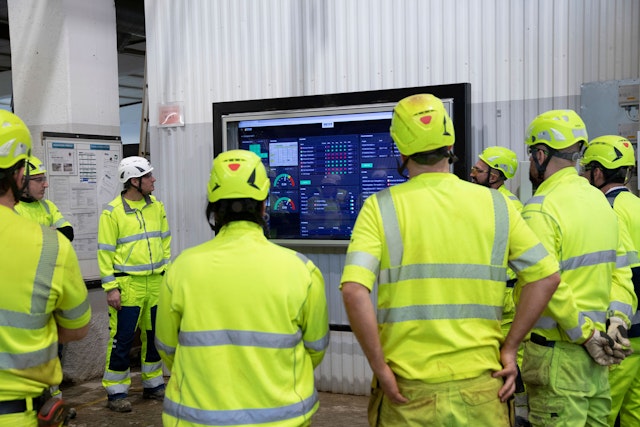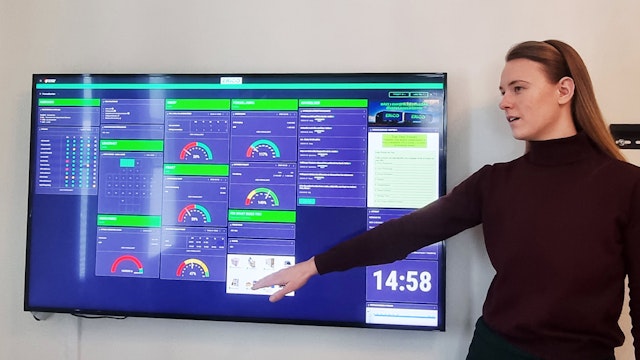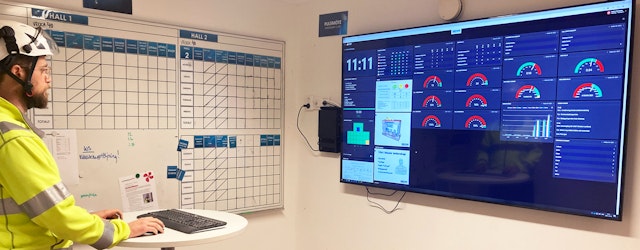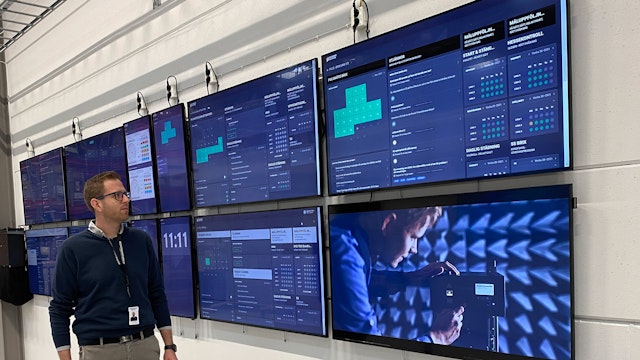
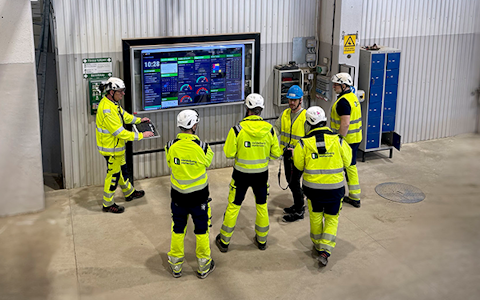
Digital dashboards that help you identify deviations and make the right decisions.

Continuous improvement, Kaizen boards, PDCA and other tools.

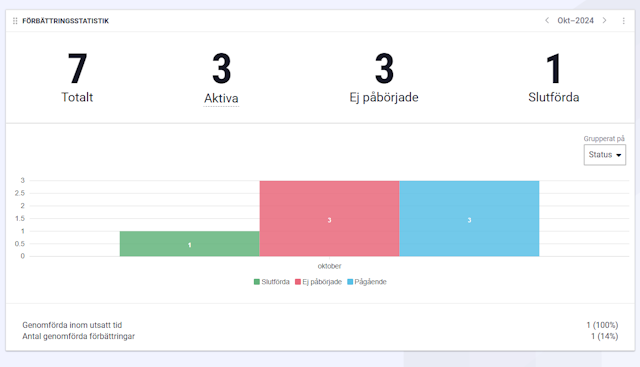
Capture your deviations and turn them into improvements

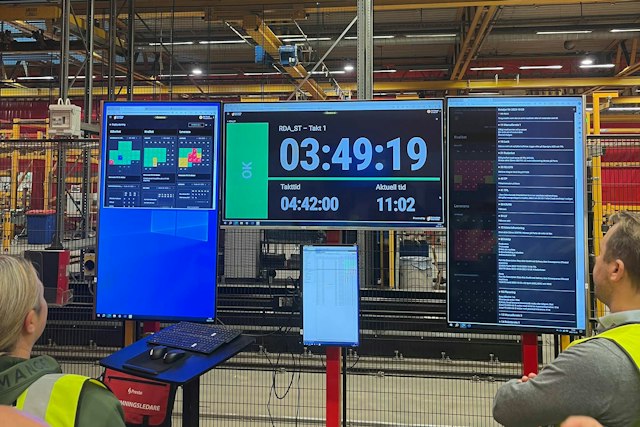
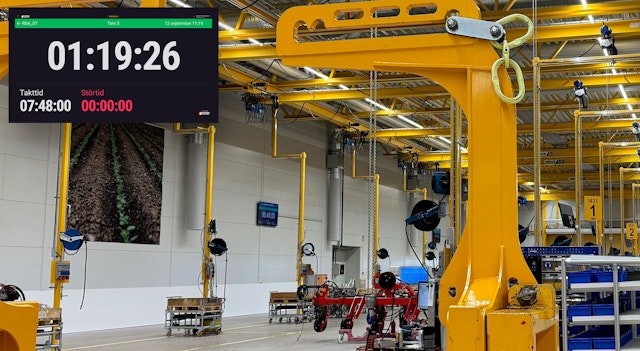
Real-time control for takt-based production. Detect disruptions as they happen, respond faster, and keep production on pace.

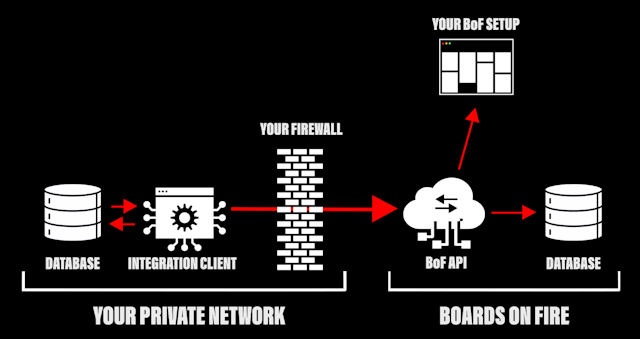
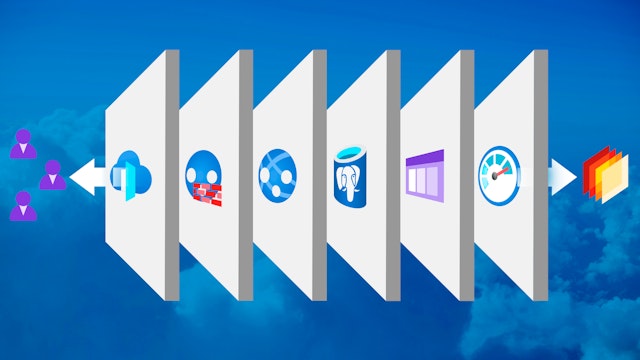
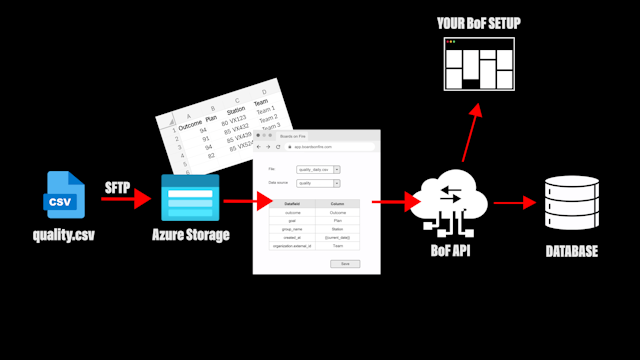
Integrate Boards on Fire with ERP, MES, OEE, Power BI and other systems. Automate data flows, reduce administration and act faster.
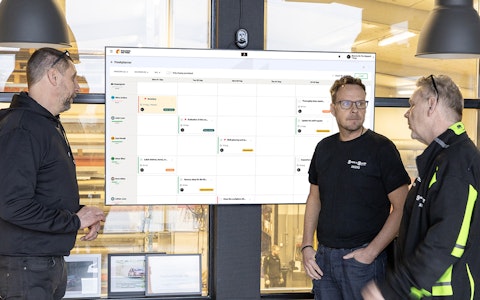
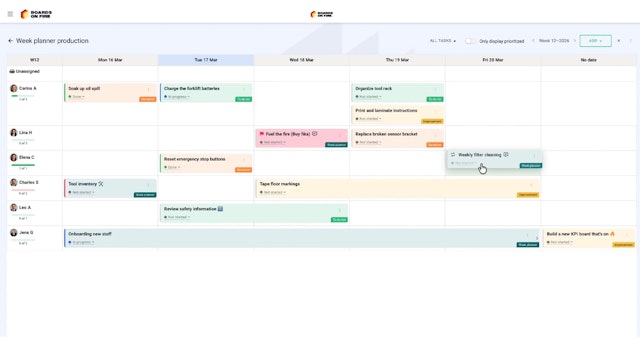
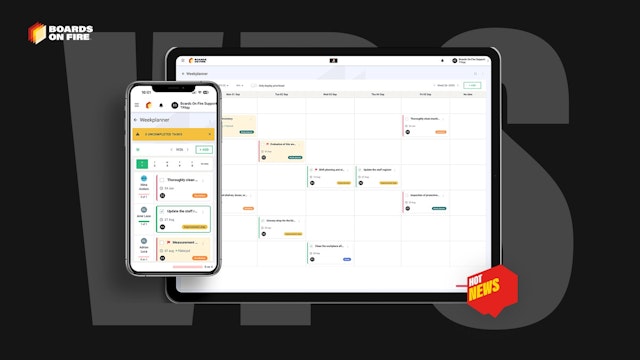
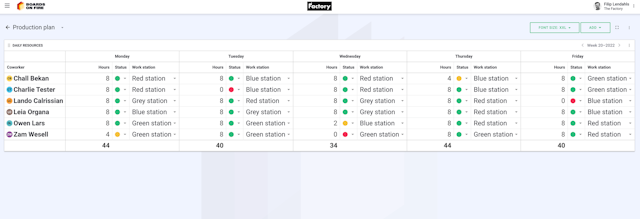
All your team’s tasks, neatly organized in one weekly view.
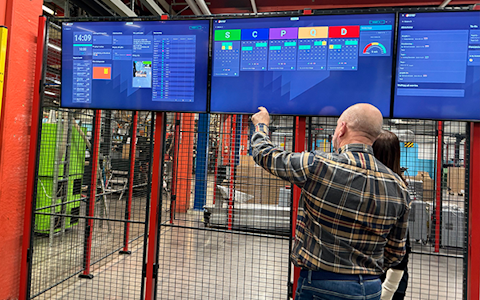
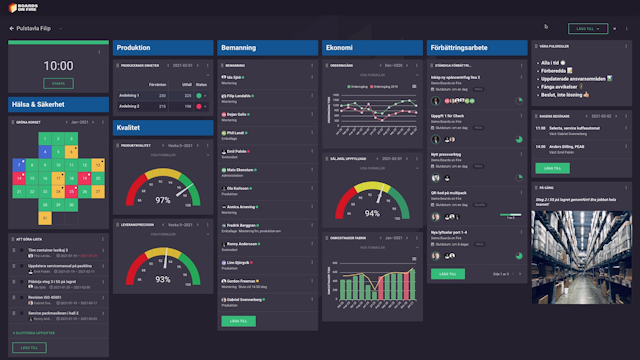
Improve key performance indicators within your specific focus areas with our SQCDP board.

Use the PDCA cycle as a tool to improve both quality and processes
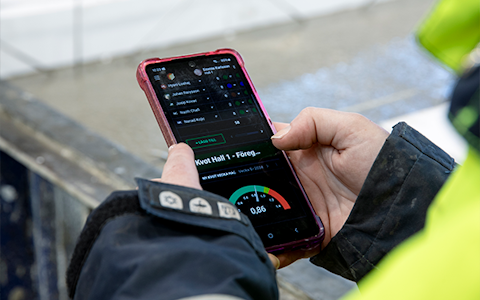
Digital tools for 5S work, recurring audits, and a well-organized workplace.

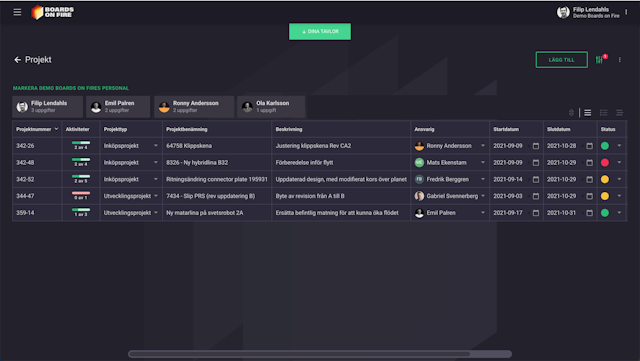
Basic project management and activity boards.
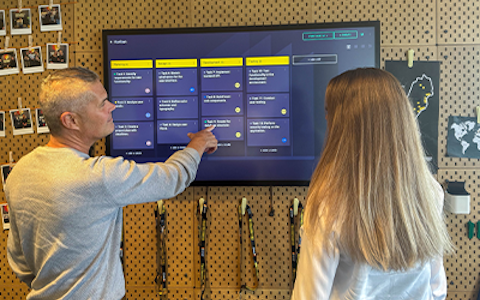
Kanban is a powerful method for visualizing, managing, and optimizing workflows.
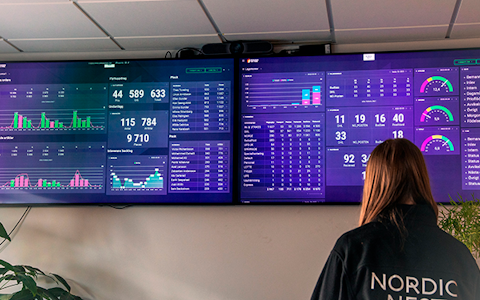
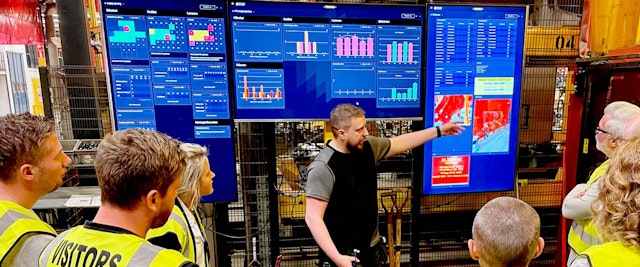
Visualize KPIs and communicate effectively throughout the entire organization.
Digital visitor registration provides full control over all planned and executed visits to your business.
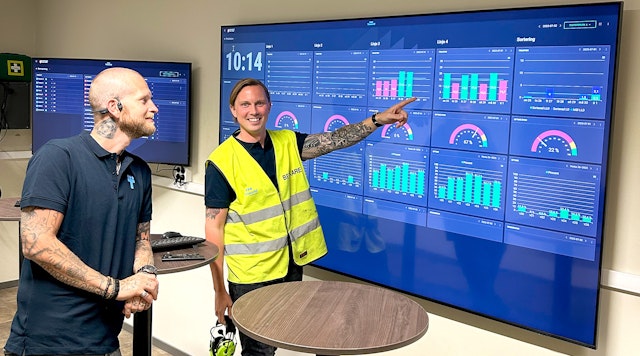
We’re taking visualization in Boards on Fire to the next level. Two new components are coming soon, giving you even better ways to analyze, visualize and use data in Boards on Fire. With the new Visualization component and Power BI component, it will be easier to make the right information clear, accessible and useful in daily work. And both will be available to all our customers at no additional cost.
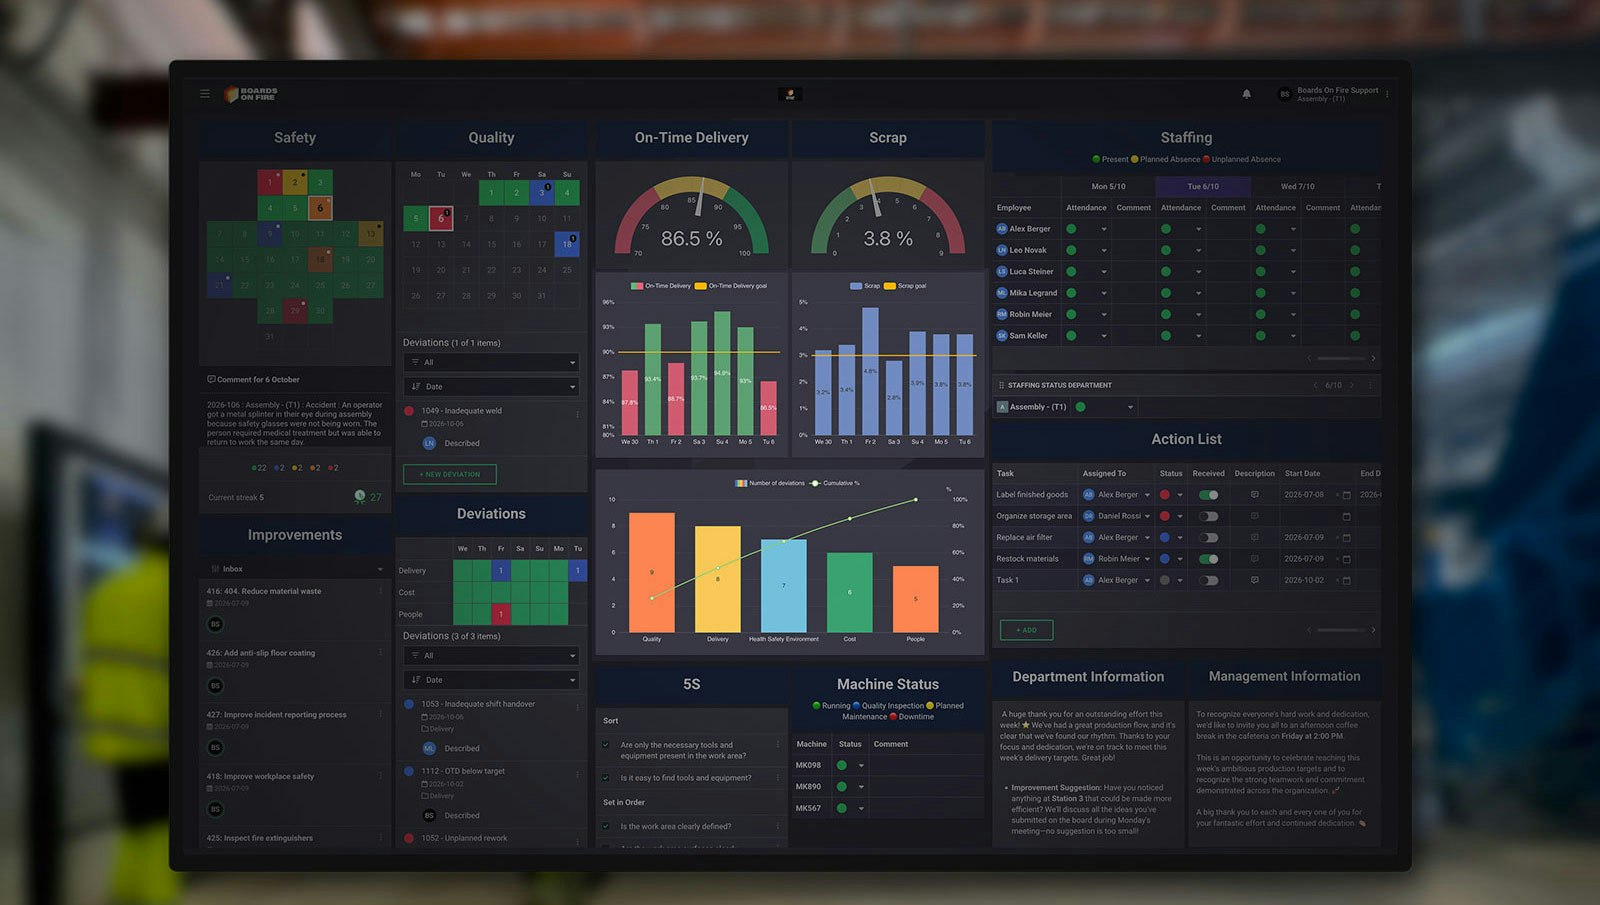
Data only creates value when people can understand it and act on it. That’s why we continue to develop new ways to bring relevant information together where it is actually needed. We are now launching two new components that do just that – in two different ways.
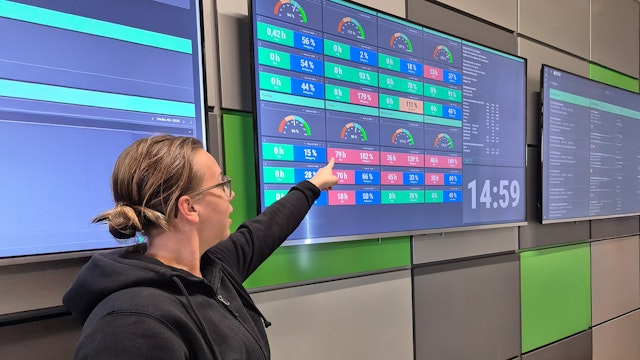
The new Visualization component gives you significantly greater flexibility to analyze and present data in Boards on Fire.
Among other things, you can connect multiple data sources, use more filters and groupings, and create calculated fields across different data sources. The component also supports additional chart types, such as Pareto charts, and can retrieve data from entities, deviations and improvements. At the same time, it delivers higher performance and faster board loading.
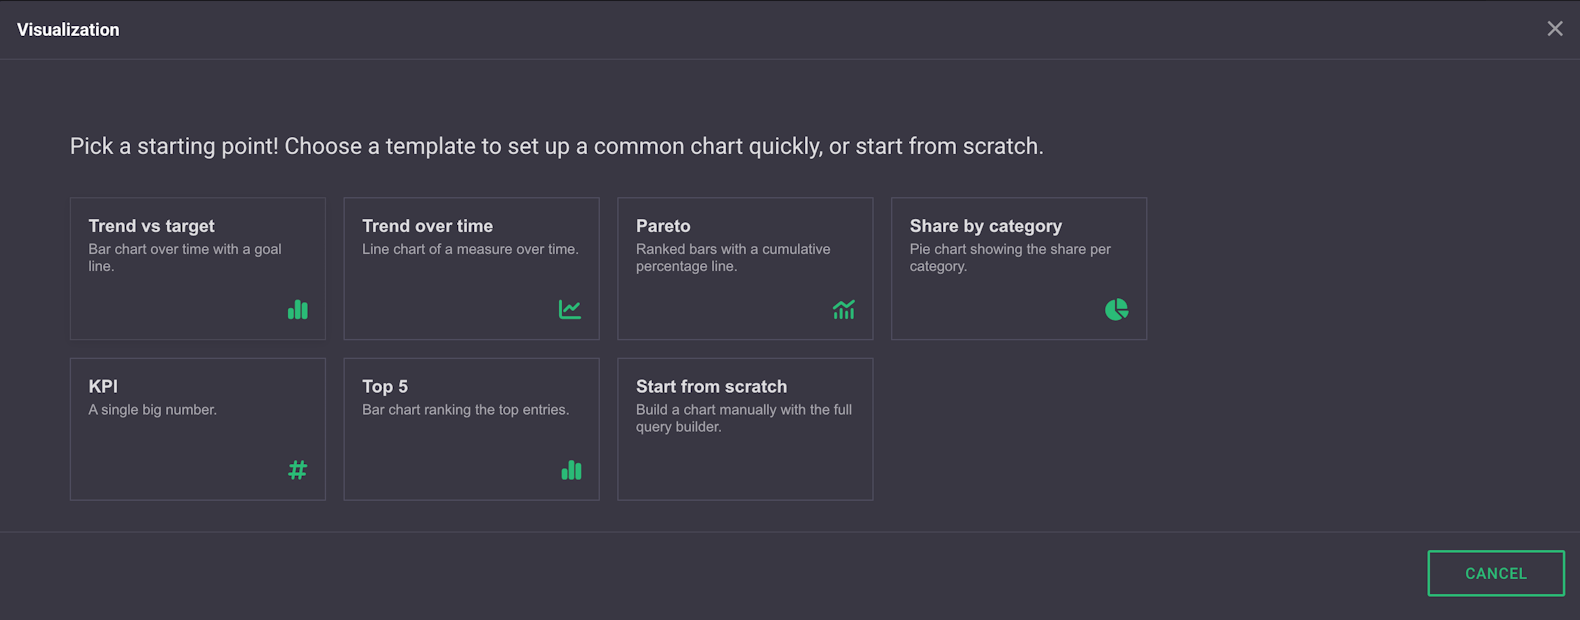
This creates better opportunities to analyze, for example, deviations, production disruptions, KPIs and improvement work, and to identify trends and relationships across the operation more quickly. More of the analysis can now take place directly on your Boards on Fire board, instead of requiring you to export data to other tools.
Many organizations also have large amounts of valuable information and analysis in Power BI. With our new Power BI component, those reports can now become a natural part of Boards on Fire.
You can view and interact with Power BI reports without leaving Boards on Fire – for example, by filtering information, drilling down into data and navigating between report pages. Each user’s existing Power BI permissions also apply when the report is displayed in Boards on Fire.
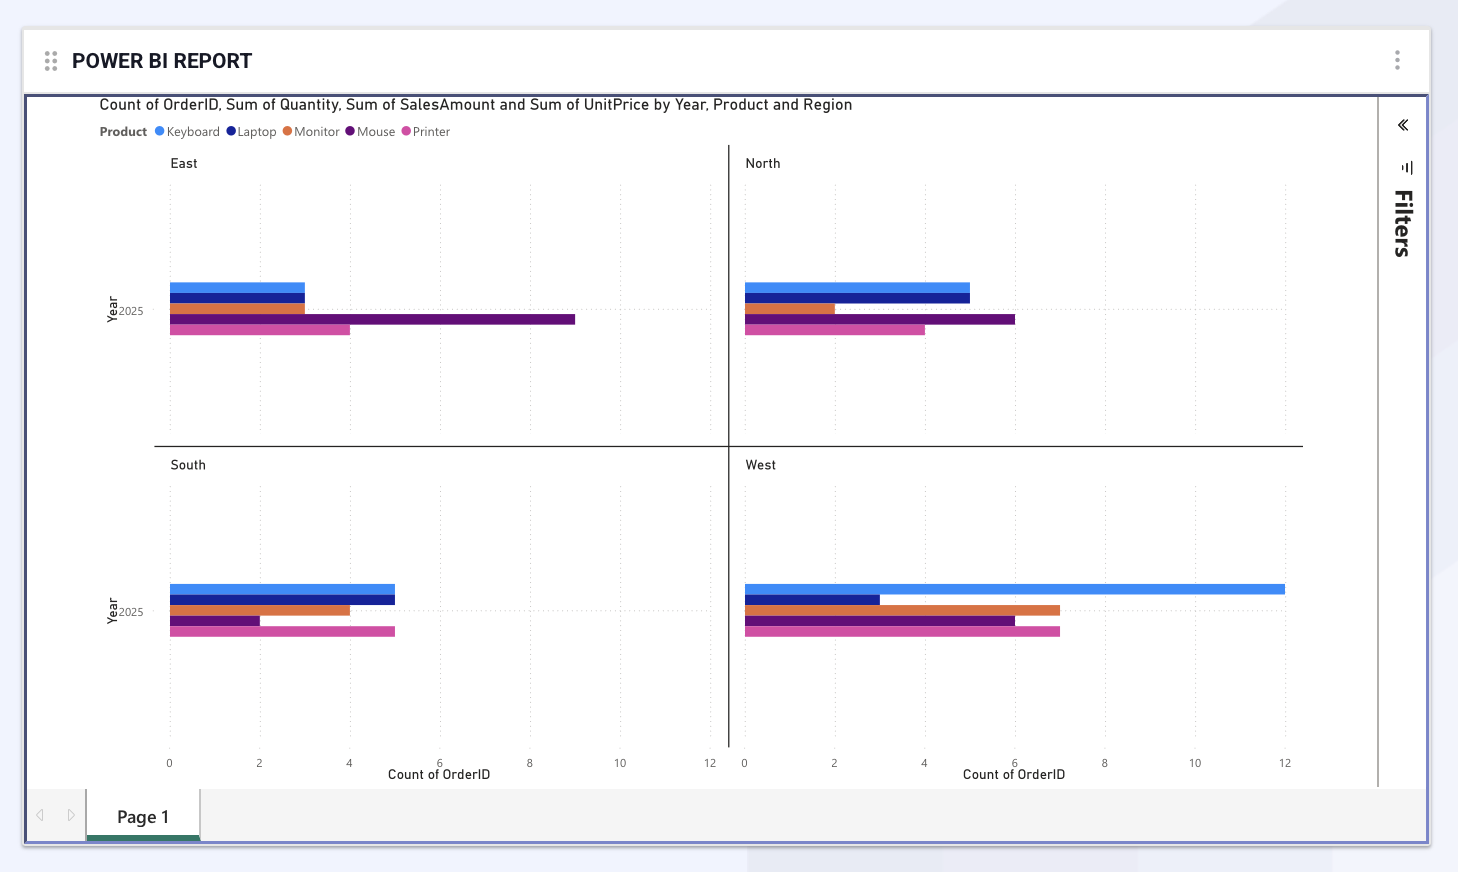
This makes it easier to bring analysis and daily work together. Information that may previously have been available only in a separate report can now be displayed alongside KPIs, deviations, activities and improvements on the board the team already uses.
The two new components address different needs, but share the same goal. The Visualization component helps you get more value from the data already available in Boards on Fire. The Power BI component makes it possible to bring your existing Power BI reports into daily management.
Together, they provide even better conditions for making data visible, understandable and useful – making it easier to see what is happening, discuss why it is happening and make better decisions.
Both components will be released soon and will be available to all our customers at no additional cost. On Tuesday, October 20, we’re hosting a free webinar where our Customer Success Team will demonstrate how they work in practice. Sign up today:
From data to action – visualize more in Boards on Fire >>
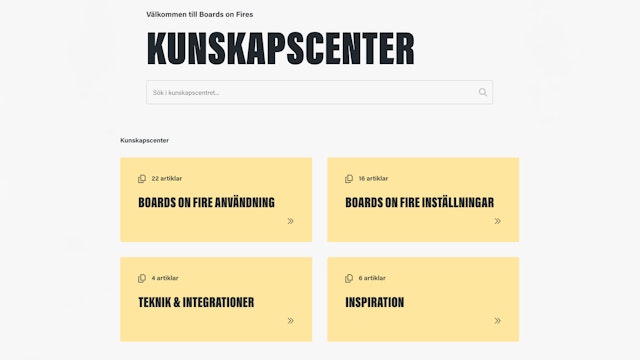
You can read more about the Power BI component in our Knowledge Center >>

Happens at Boards on Fire
Free web demo