
Digital dashboards that help you identify deviations and make the right decisions.

Capture your deviations and turn them into improvements
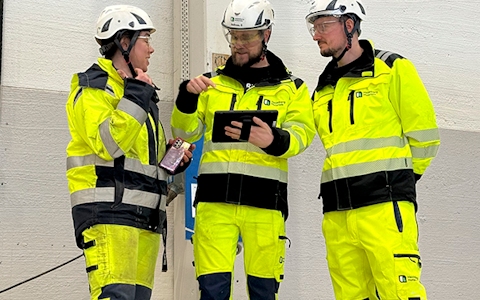
Continuous improvement, Kaizen boards, PDCA and other tools.
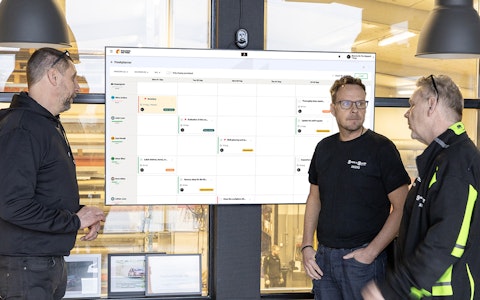
All your team’s tasks, neatly organized in one weekly view.
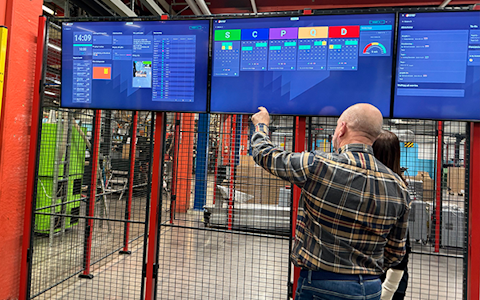
Improve key performance indicators within your specific focus areas with our SQCDP board.

Use the PDCA cycle as a tool to improve both quality and processes
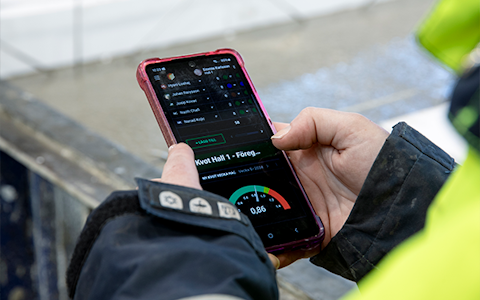
Digital tools for 5S work, recurring audits, and a well-organized workplace.
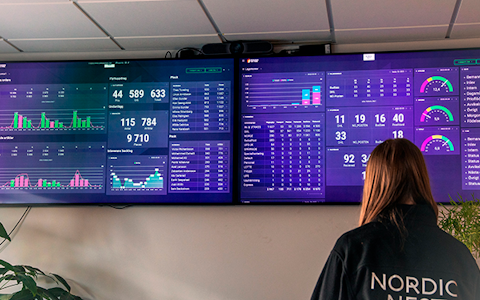
Visualize KPIs and communicate effectively throughout the entire organization.

Basic project management and activity boards.
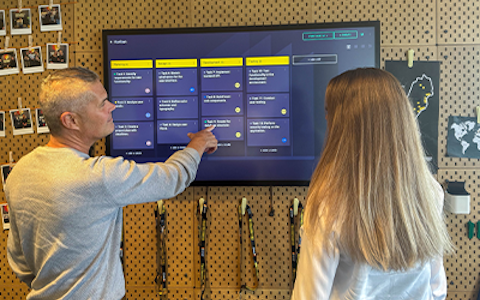
Kanban is a powerful method for visualizing, managing, and optimizing workflows.
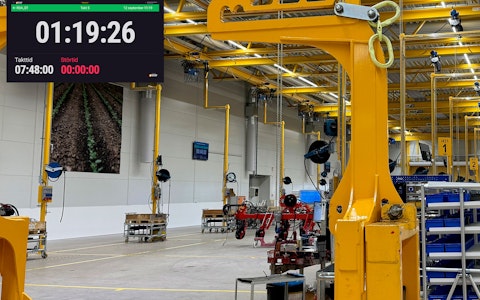
Digital dashboards for takt time flow with takt time counter and stop time log.

Digital visitor registration provides full control over all planned and executed visits to your business.
We are launching our new deviation module, which comes fully equipped with everything you need to manage deviations in all areas of the business. With the connection to the improvement module, the entire flow from deviation to implemented improvement is seamlessly managed.

Deviations can be managed in several different views, such as the classic Safety Cross, calendar view, or an overview view.
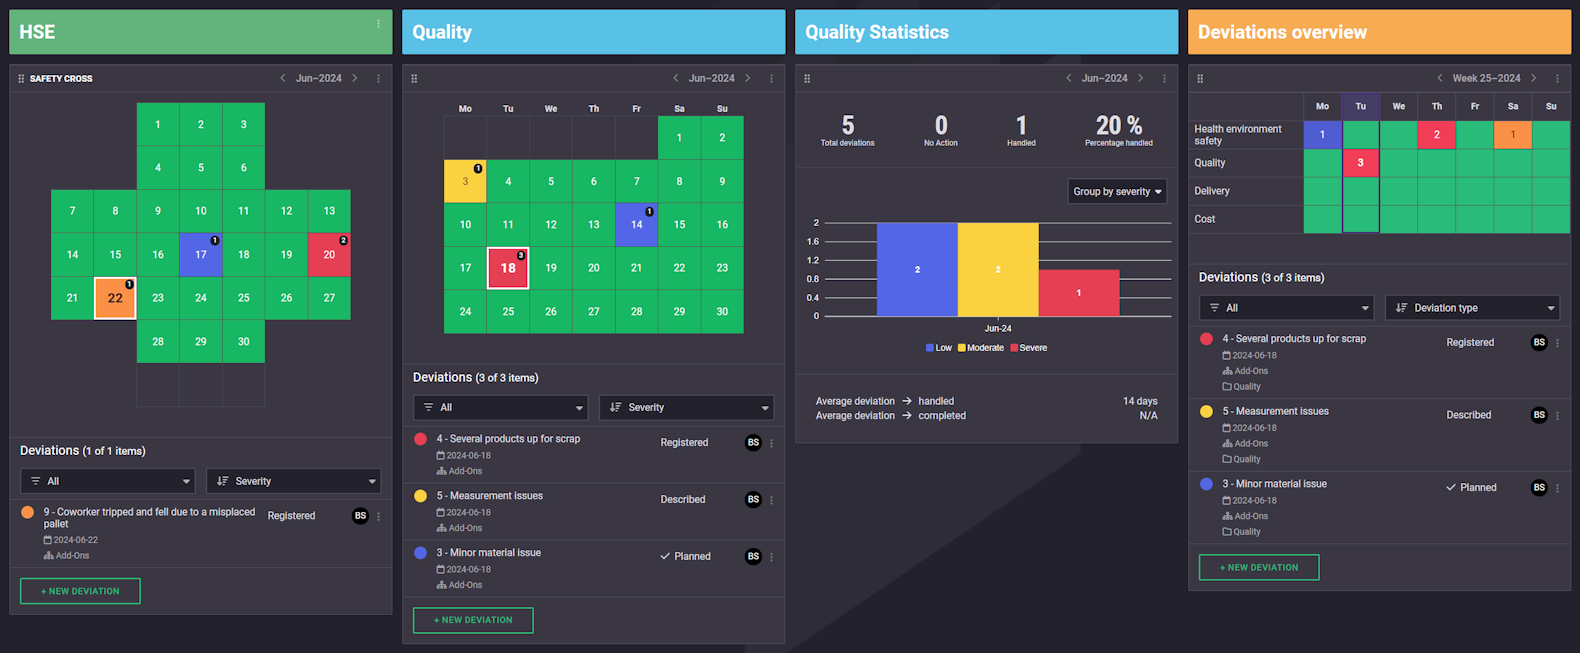
It is now easy to manage each deviation as its own case – they are indexed and given a unique serial number. This makes it easy to create and manage multiple deviations per day! Below is an example of three registered deviations on June 18.
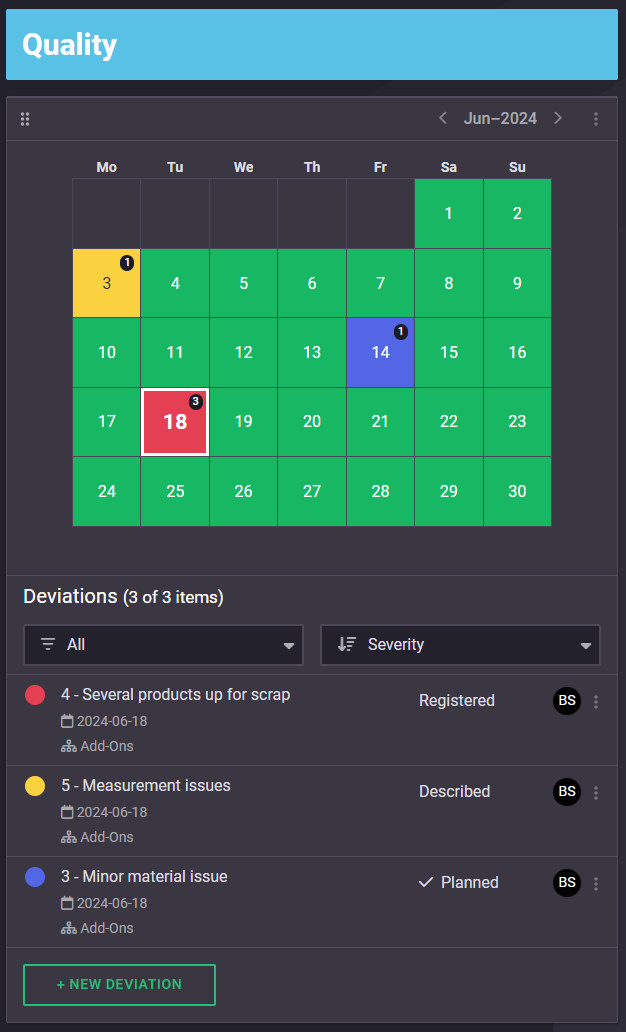
Since each deviation becomes a unique case, they are also assigned a state depending on where you are in the handling process. This makes it easy to get an overview of your deviation progress.
We have built this module with all tiers in mind. We want to capture all the organization's deviations – and that requires a simple but seamless form! Therefore, the creation flow is very easy. Select the component that handles the type of deviation you want to register (e.g., Quality) and click “+ New deviation.” Here, only a Severity level and title need to be filled in – then the deviation can be created!
You can easily do this via your phone in roughly 10 seconds.
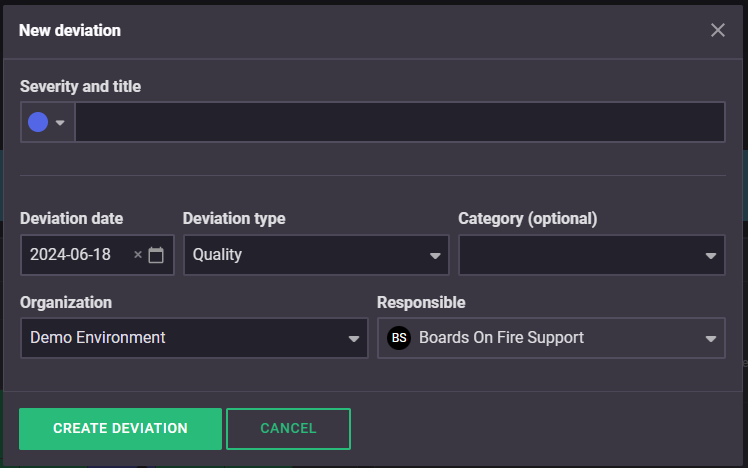
After the deviation is created, it can be further processed. We will go through this flow in more detail in an upcoming blog post, but as you can see in the image below, there is a seamless flow for handling.
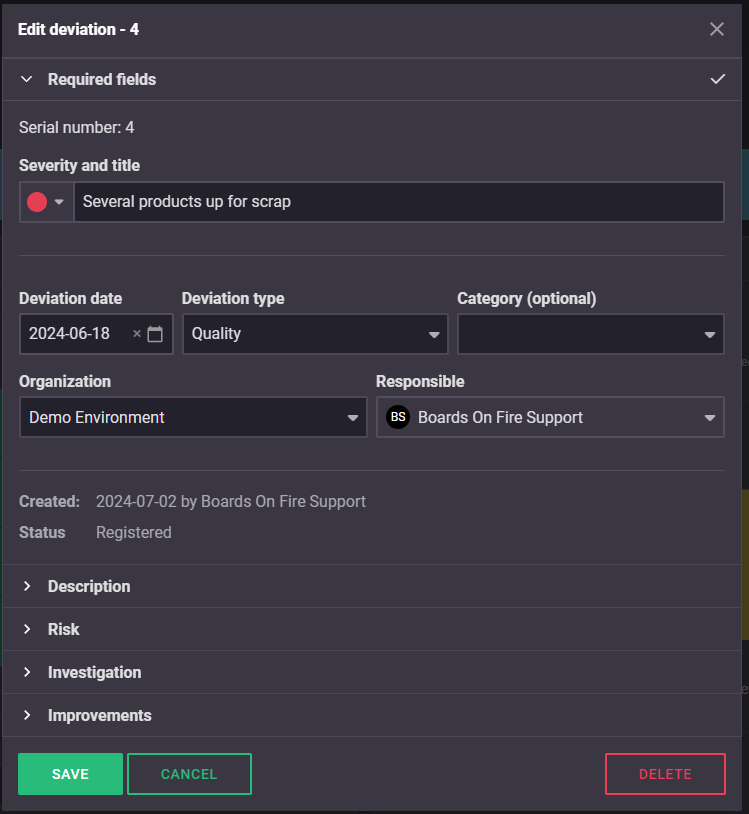
Now you get the entire flow from deviation to implemented improvement in Boards on Fire. Create the deviation based on a component in Boards on Fire, maybe a deviating KPI figure, and follow the entire deviation flow. Then create improvement actions to ensure that the deviation does not occur again! Everything is interconnected, and you can see the link between deviations and improvements.
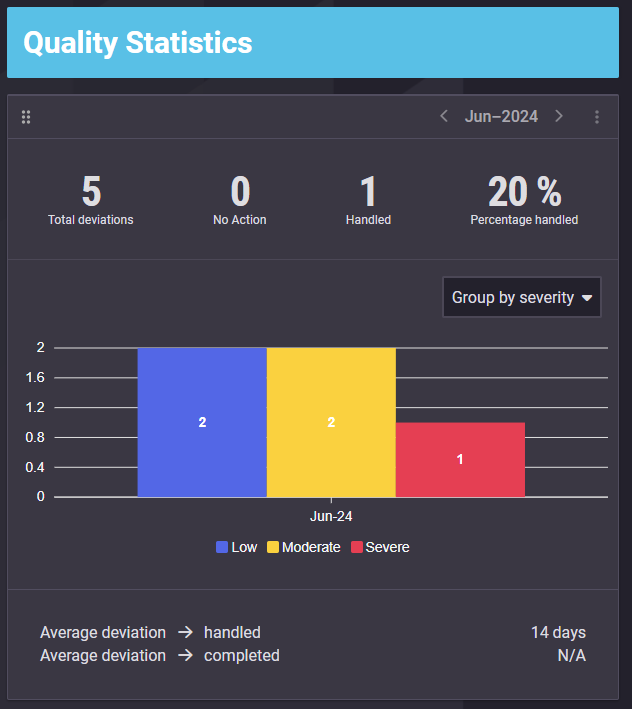
In addition to the deviation module, we added a component for deviation statistics. Now you can see how many deviations have been registered and handled. They can also be grouped in different ways. In the fall of 2024, we will further develop this with an additional view for more detailed statistics.
Happens at Boards on Fire
Free web demo