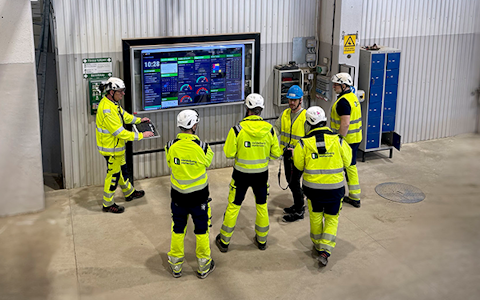
Digital dashboards that help you identify deviations and make the right decisions.
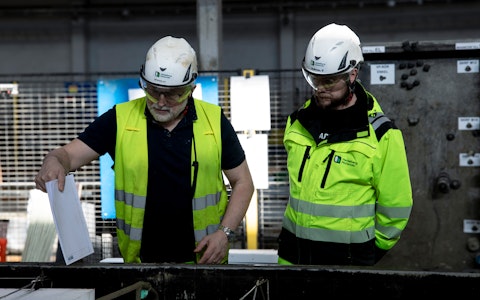
Capture your deviations and turn them into improvements
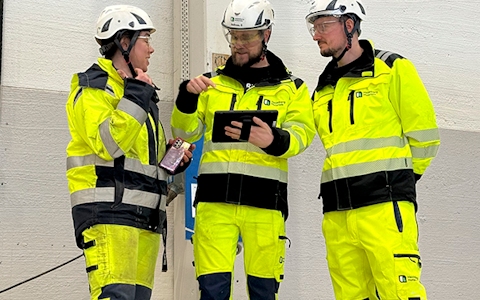
Continuous improvement, Kaizen boards, PDCA and other tools.
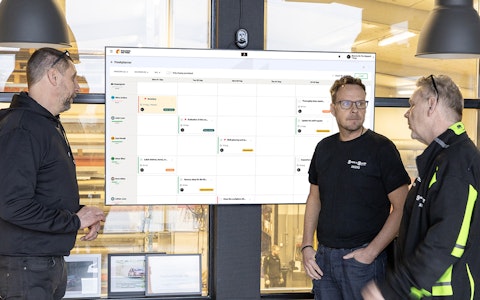
All your team’s tasks, neatly organized in one weekly view.
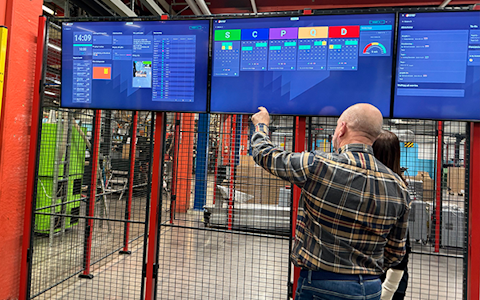
Improve key performance indicators within your specific focus areas with our SQCDP board.
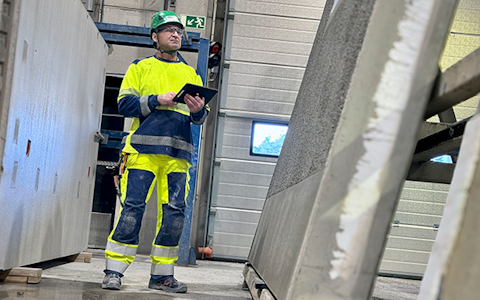
Use the PDCA cycle as a tool to improve both quality and processes
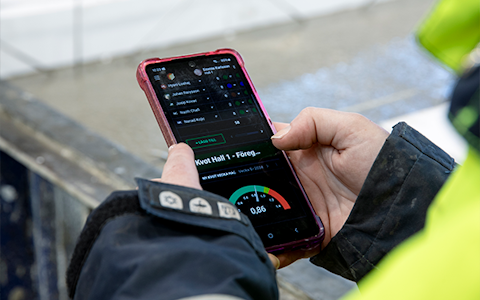
Digital tools for 5S work, recurring audits, and a well-organized workplace.
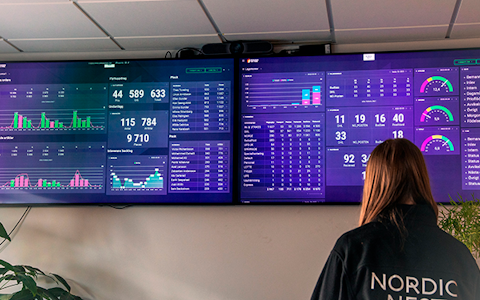
Visualize KPIs and communicate effectively throughout the entire organization.

Basic project management and activity boards.
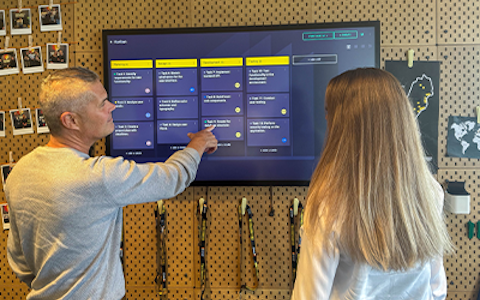
Kanban is a powerful method for visualizing, managing, and optimizing workflows.
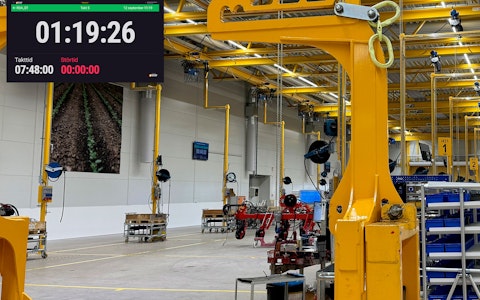
Digital dashboards for takt time flow with takt time counter and stop time log.
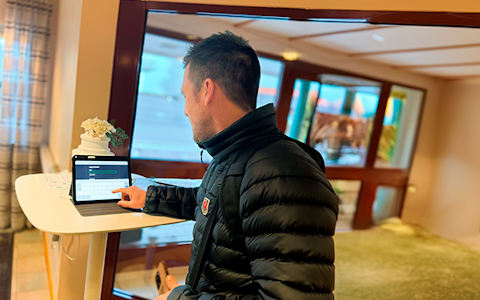
Digital visitor registration provides full control over all planned and executed visits to your business.
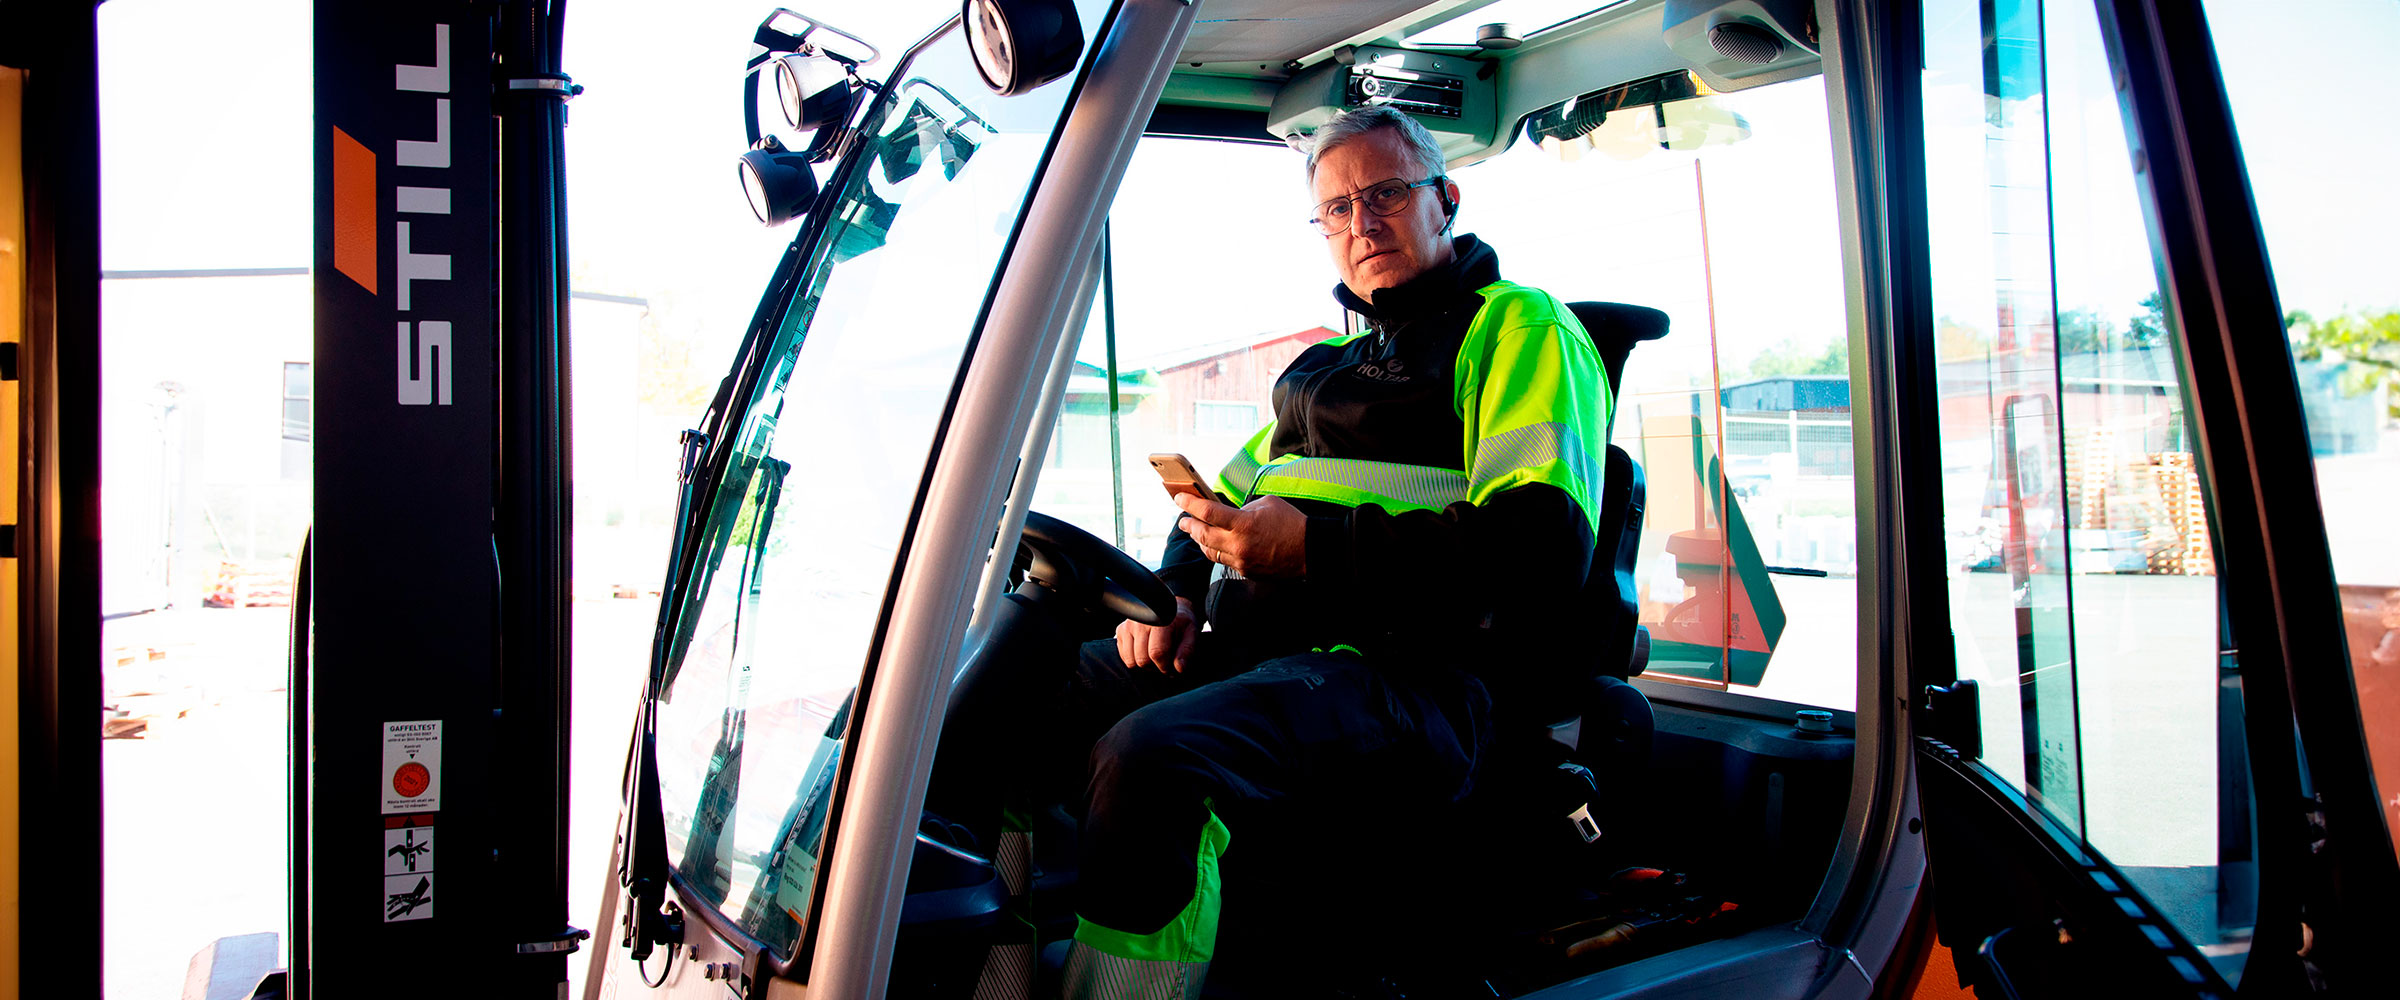

Board on Fire’s project module gives you full control over all projects and activities in your organization. Plan and assign tasks. Track progress and follow up on results. Book a demo, and we’ll show you more!


In the project module, just like in the rest of Boards on Fire, you can create a free number of boards for your projects and activities. The functions are many and the content can be visualized both independently and as components on your pulse meeting boards.
Each project becomes a row on the project board and the board can be expanded with different types of columns adapted to the information you want to log in your projects.

You have text columns for, among other things, project names and descriptions of the project. Predefined lists that can indicate project type or in which department a project belongs. You can specify which employee is responsible for the project, set start and end dates and update status as the project progresses. There are number columns that can be used to set a budget for the project and log the outcome. And so on.
A key feature is that you can add sub-tasks to each project. You give the task a name, decide who will perform it and when it will be done. Under additional information, you can add a more detailed description if needed.
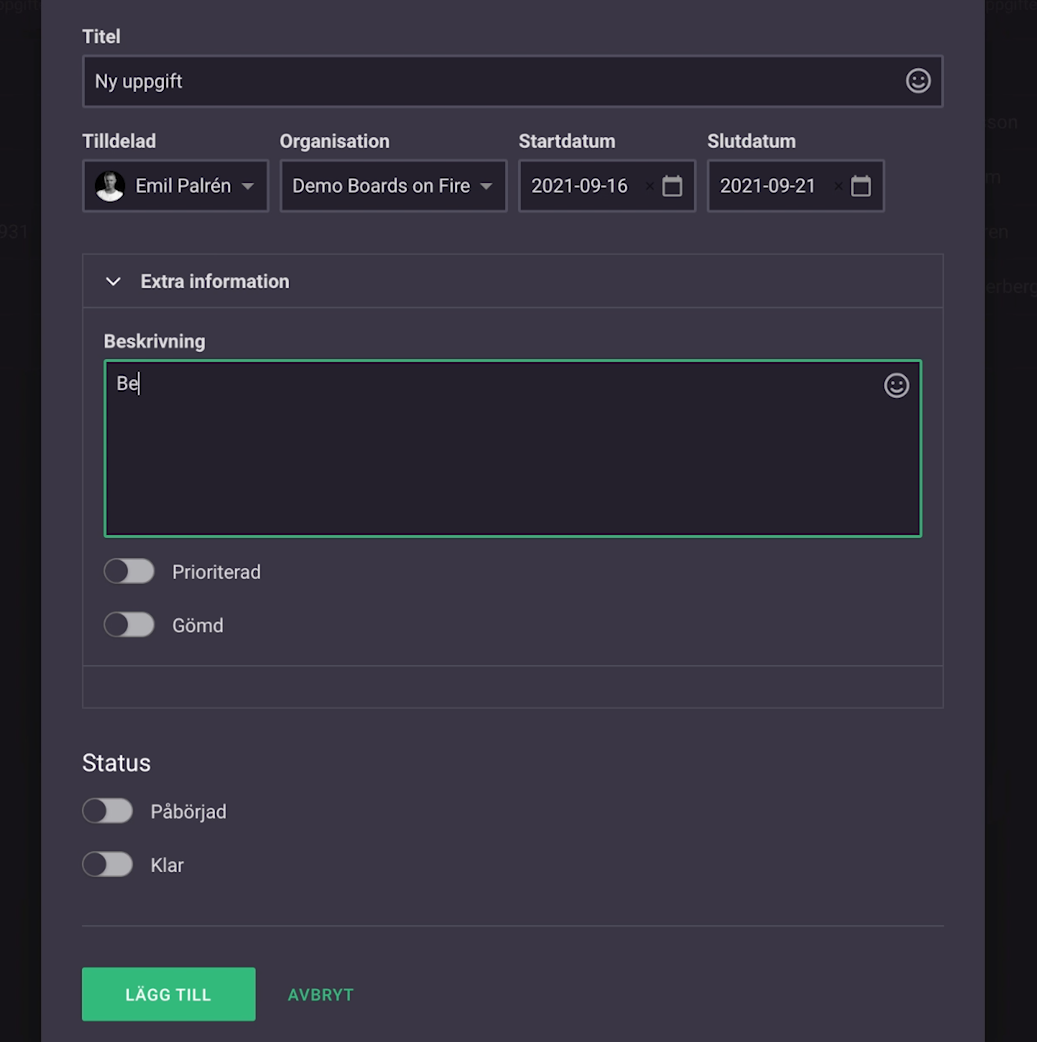
You mark the sub-task checkboxes as they are performed, so that progress can be seen on the board.
You can also create default tasks that are added automatically every time you create a new project.
The dashboard can be displayed in three different views. You have the default view with all the projects in each row. You can also choose to view the projects with all their underlying sub-tasks. And finally, you have a gantt chart where you see the projects on a timeline in relation to each other. You can show it in weekly or day view and choose to show with or without sub-tasks.
Free web demo
You can filter at the individual level to see all the tasks that a specific employee is responsible for in the various projects. Say, for example, that someone has reported sick. Then you can quickly go in and check if that person has any current information that needs to be delegated to someone else or maybe moved forward in time. If you choose to advance a task in a project, you will automatically be asked if you also want to advance other sub-tasks that remain to be done in the same project.

You can also filter the board based on the columns you want show. For example, show all projects within a certain date range, of a particular type or with a certain status, and so on.
Each group or department can have its own project board and you can share projects and information between them. The project module can be connected directly to our pulse meeting dashboards in Boards on Fire, but it can of course also be used on its own.