Digital dashboards that help you identify deviations and make the right decisions.
Capture your deviations and turn them into improvements
Continuous improvement, Kaizen boards, PDCA and other tools.
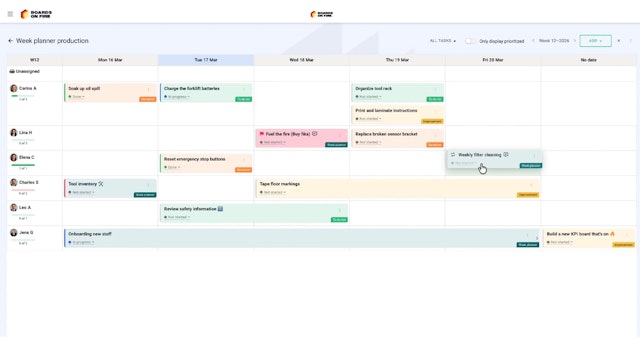
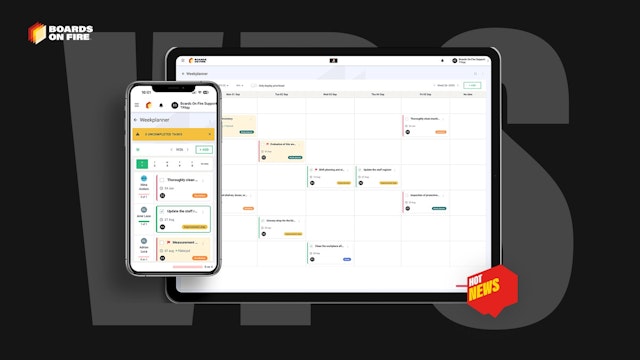
All your team’s tasks, neatly organized in one weekly view.
Improve key performance indicators within your specific focus areas with our SQCDP board.

Use the PDCA cycle as a tool to improve both quality and processes
Digital tools for 5S work, recurring audits, and a well-organized workplace.
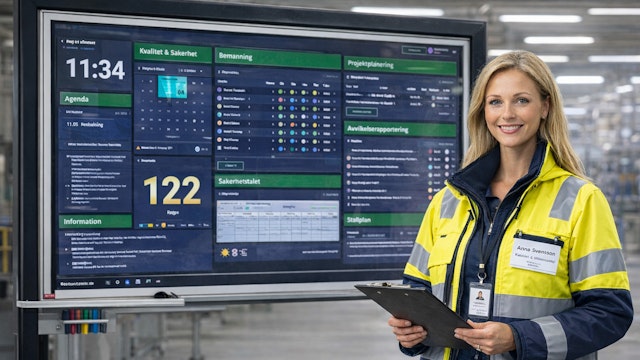
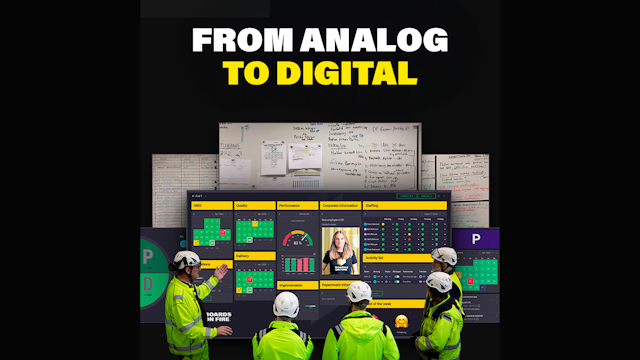
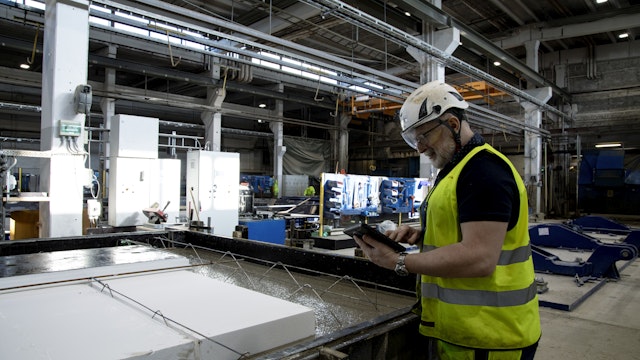
Visualize KPIs and communicate effectively throughout the entire organization.
Basic project management and activity boards.
Kanban is a powerful method for visualizing, managing, and optimizing workflows.

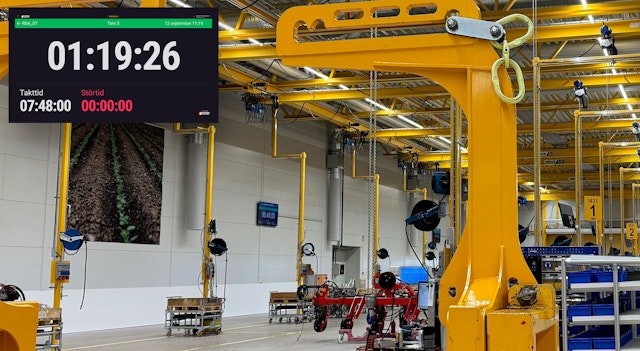
Digital dashboards for takt time flow with takt time counter and stop time log.
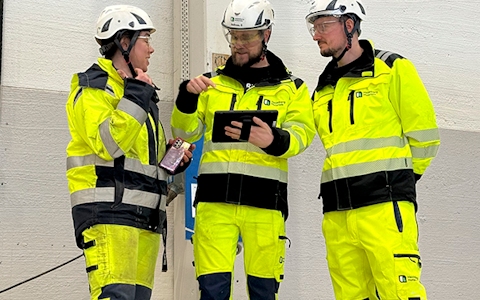
Digital visitor registration provides full control over all planned and executed visits to your business.
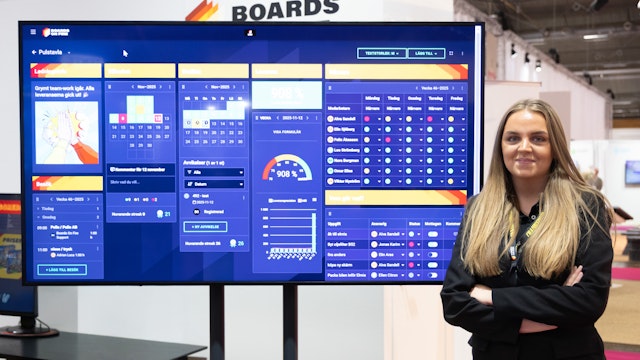
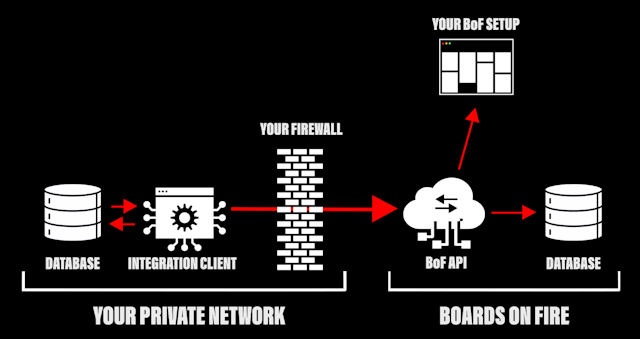
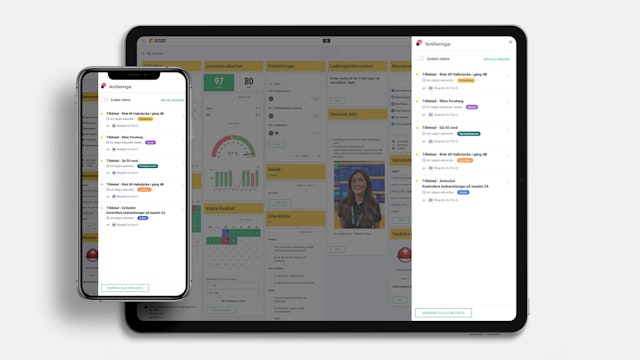
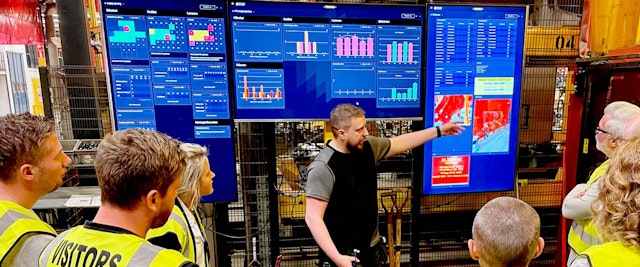
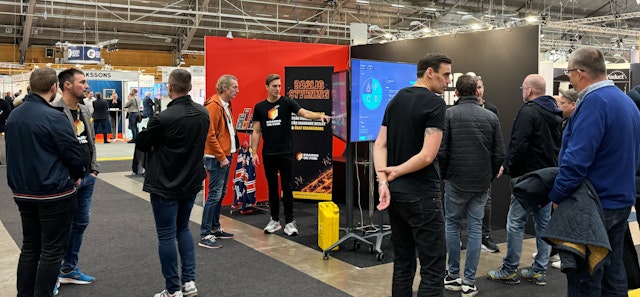
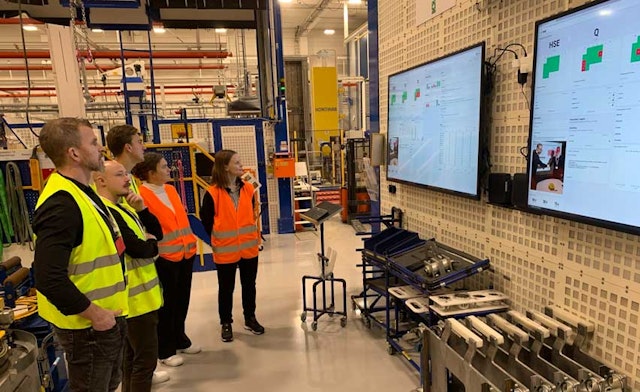
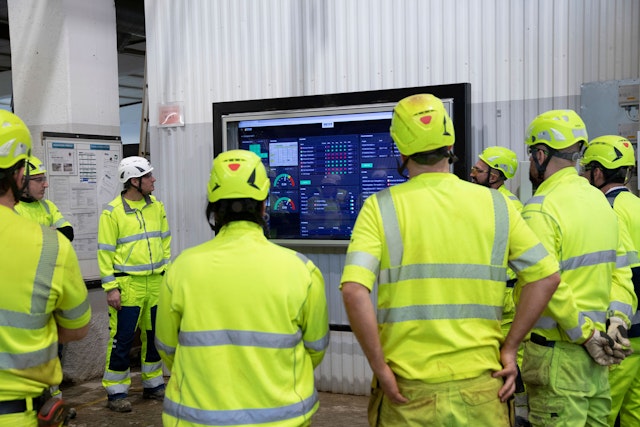
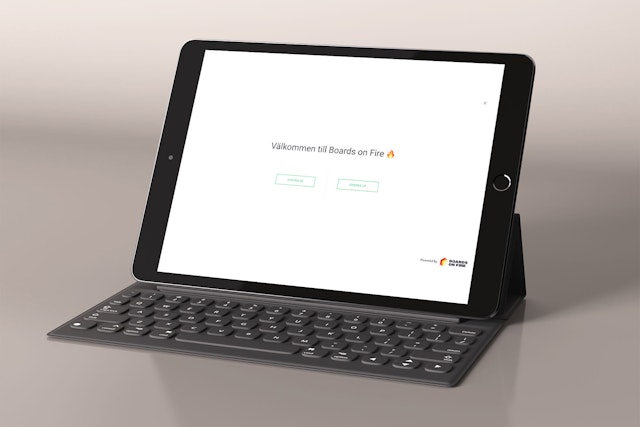
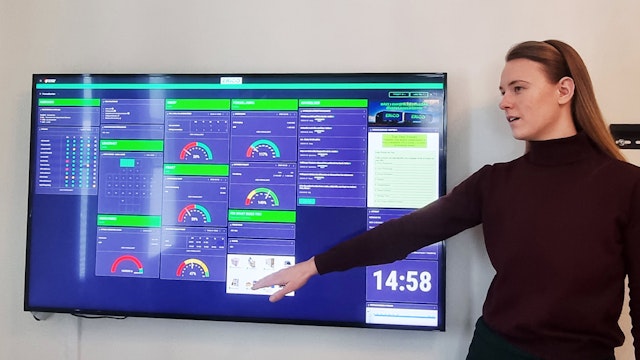
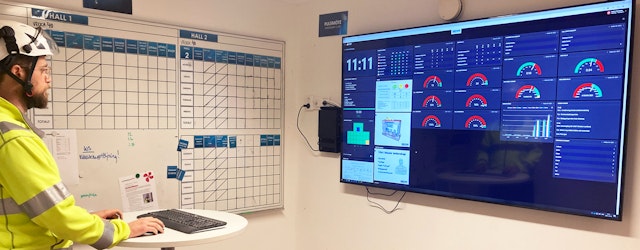
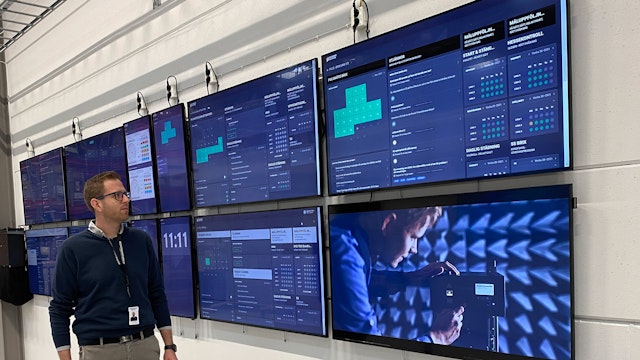
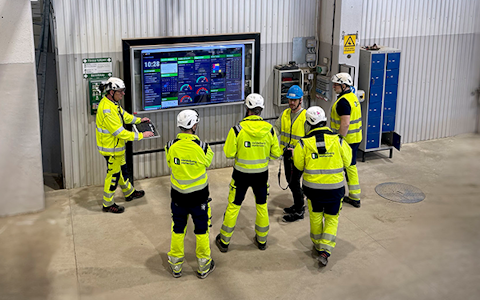
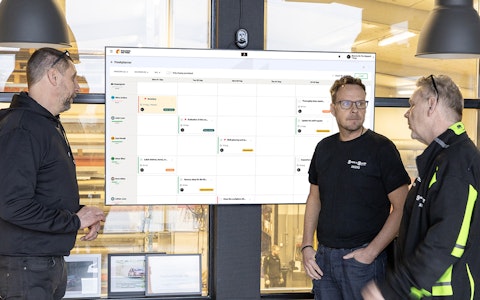
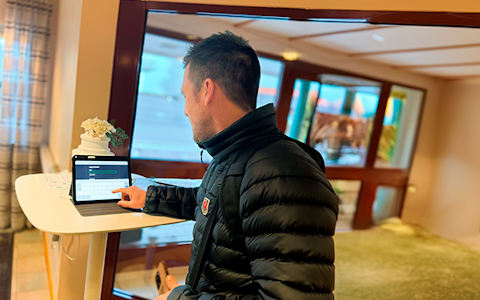
Boards on Fire is a cloud service. You can access your boards on your computer as well as on your Ipad or smartphone. Anywhere, anytime, as long as you have an internet connection. Hold your pulse meetings at a big screen and visualize important information and data.
You log in via app.boardsonfire.com or you go to our website boardsonfire.com and click log in in the top right corner. When you log in to Boards on Fire, you must first choose which organization you want to work with. A user can belong to one or more different organizations. Once you have made your choice, you will end up on the start page where you can access all the boards that belong to that particular organization.
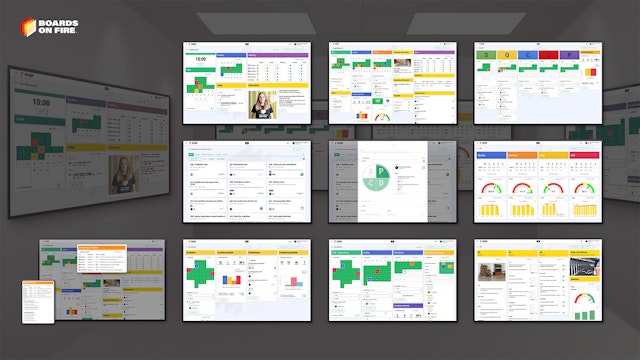
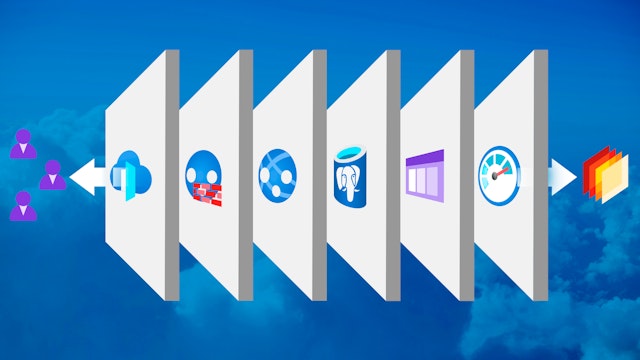
Simplified, we can say that we have three different types of boards in Boards on Fire, each of which fulfills slightly different functions. And connected to them, we also have a great module for continuous improvements.
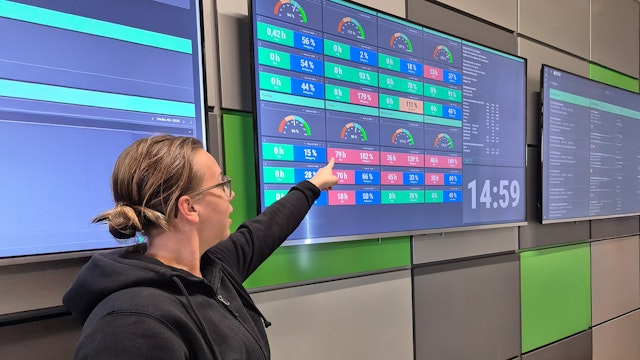
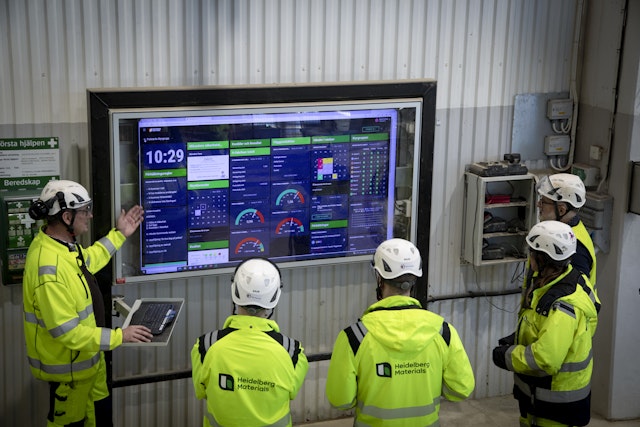
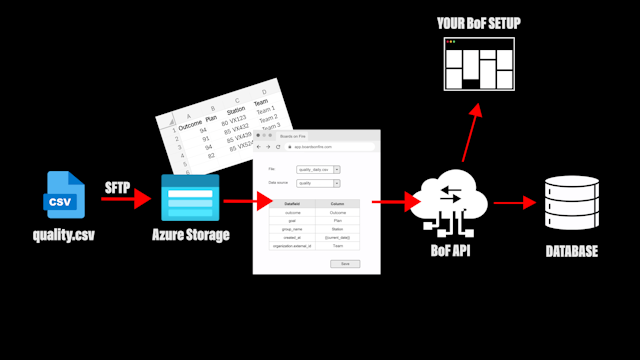
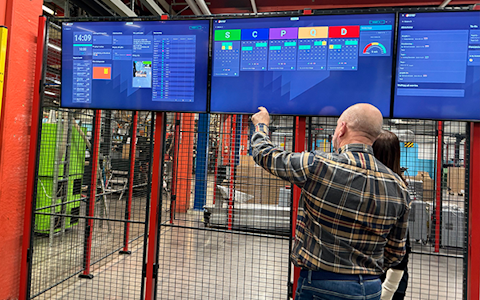
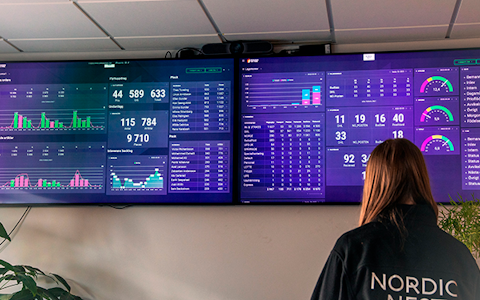
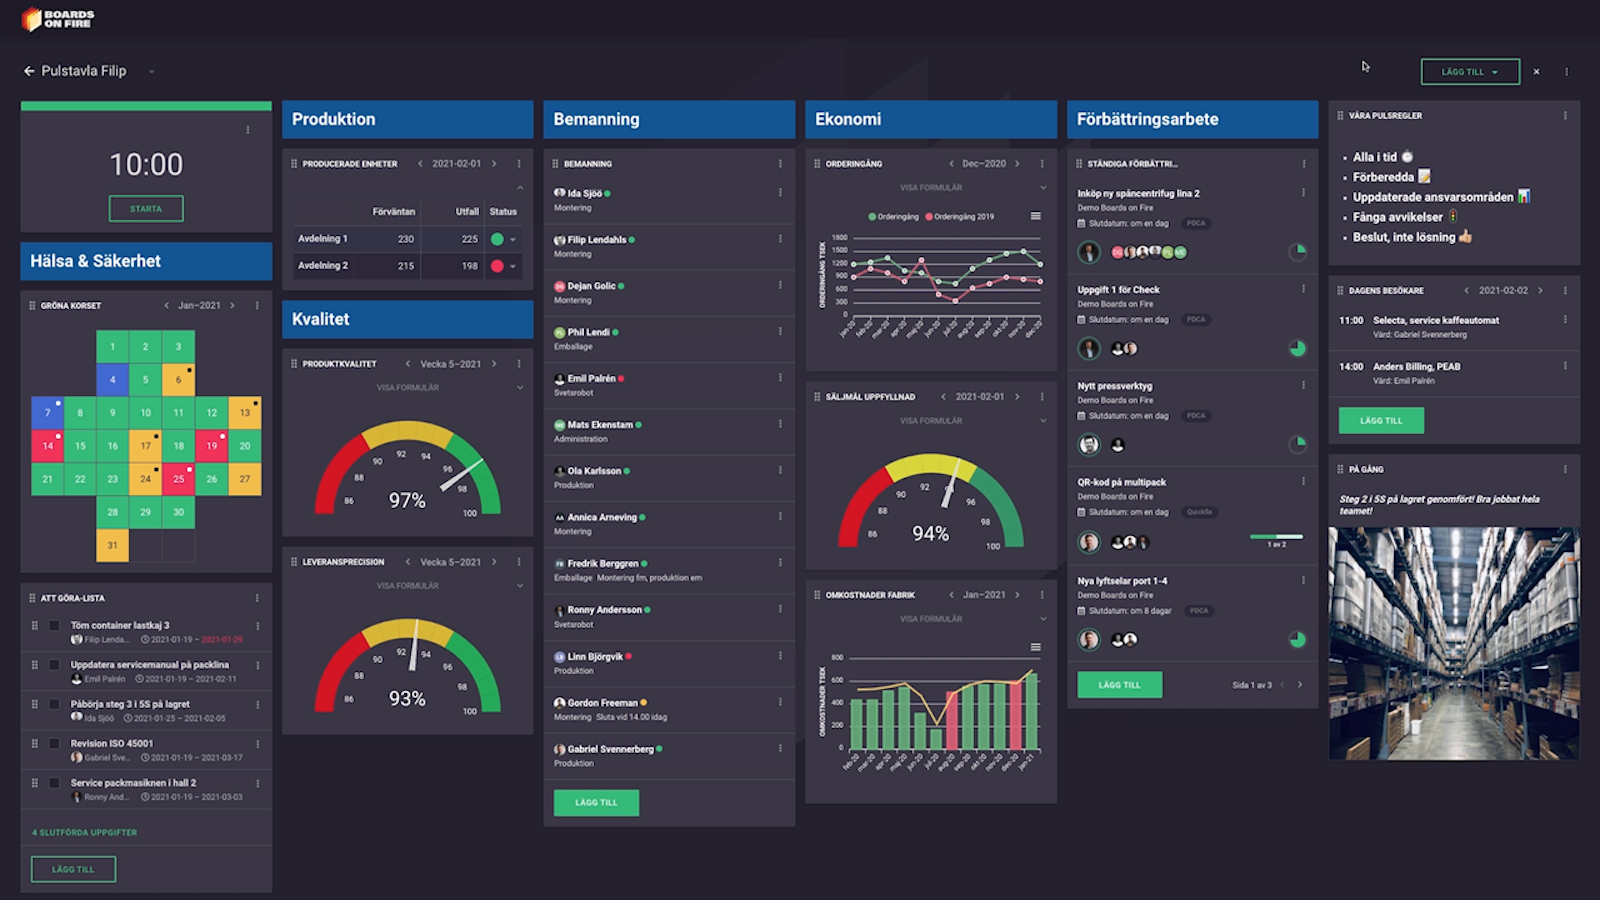
At the top here we have the dashboards. Those can be filled with a number of different components to follow up key figures and register deviations regarding health / safety, quality, production, delivery, and so on. You can type in data manually, but we can also integrate with your ERP or other sources to retrieve data and update your boards automatically.
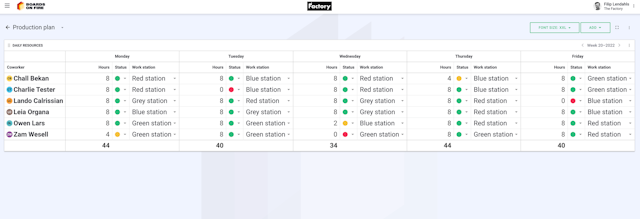
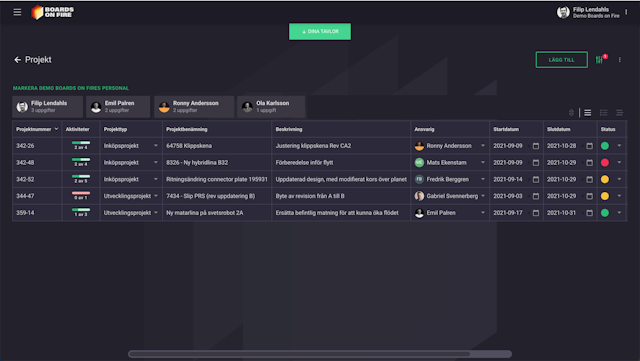
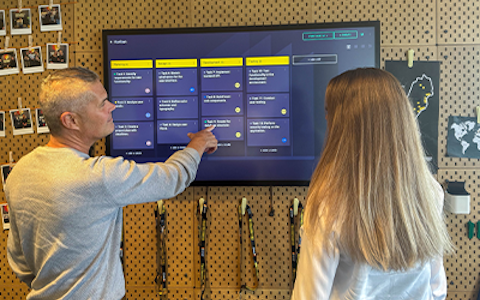
The activity boards are our solution for project management, handling deviations or other activities in a structured manner. Each activity or project will have its own row on the board and there are many different column types you can use depending on what information you want to enter about your activities. For example, plain text fields in this case a project description. Lists of all users to put someone in charge of each activity. You can add different tasks to your projects and assign them to the right person. You can set a start date and a deadline for each activity. Use a traffic light to indicate status. And so on. Each team or department can have its own board and you can share information between them.
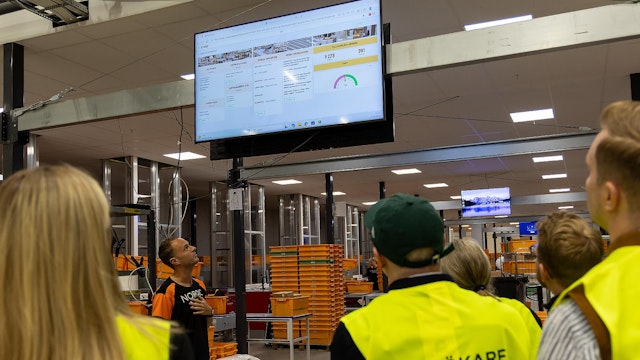
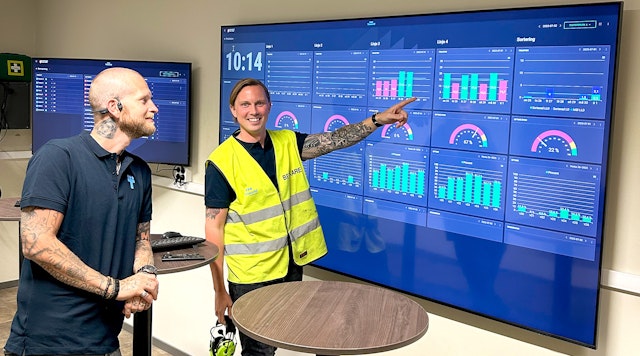
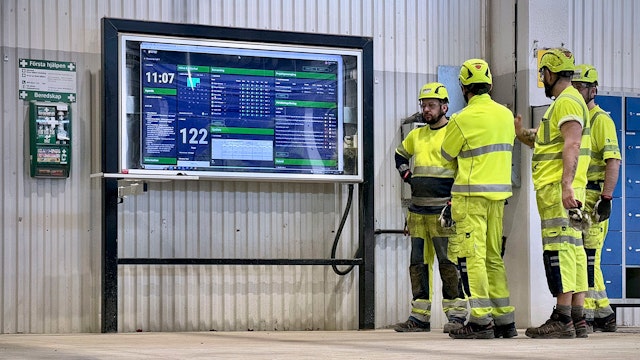
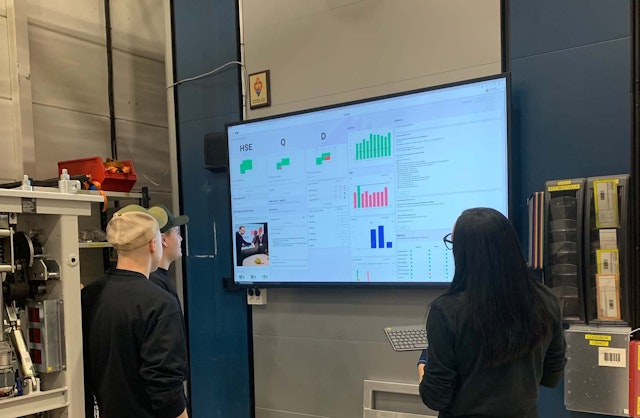
Finally, we have the display boards. They can, for example, retrieve data from a machine or a production system to display production rates or OEE numbers in real time on screens on the production floor.
In Boards on Fire we adapt the organizational structure adapted to fit your operation. There is always a main organization unit and usually a number of sub-organizations in one or more levels. Regardless of how your business is organized, each unit that needs its own boards will also be its own organization unit in Boards on Fire. The great thing about our solution is that all data and information that is entered or retrieved on one of these boards can then be escalated or aggregated from each individual board all the way up to a single view at the top. Information can also flow in the other direction or be shared between different organizations at the same level in the chart.
The threshold to get started is really low. If you want, you can start with just a few components and then expand with more features as you develop your pulse meetings. There are a number of different components to choose from with flexible settings that allow them to cover most needs. The content of the board adapts to the size of the screen. You can choose from a bunch of different layouts. And you can move and place the individual components in the order you want them.
The Safety Cross is a common tool for following up health / safety and log risk observations, incidents and accidents. Each department or team can have their own safety crosses and the information from them is escalated and merged into a common cross for the entire operation. We also have a calendar shaped component with exactly the same features and functions as the safety cross. Which you can use to log deviations in any other area such as quality, cost, delivery etc.
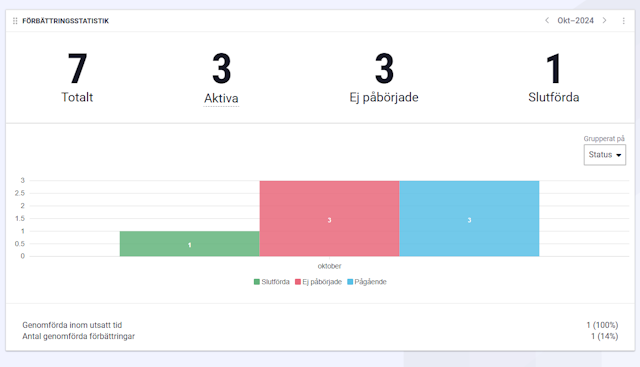
You can track key figures and deviations for health safety, quality, cost, delivery and production. Visualize data in graphs and link the board to our module for continuous improvements.
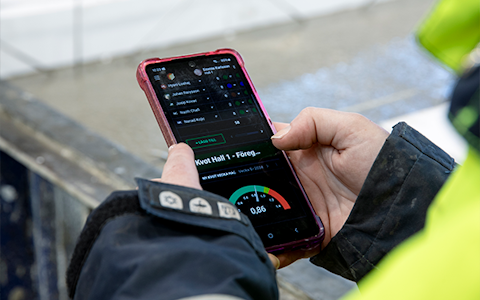
Data components with different graphs that show, for example, order intake month by month, overheads, speedometers that provide a current picture of delivery precision or production quality. You can fill them in manually or we will integrate them with your ERP or other sources to retrieve the data automatically.
All data components can be adapted to the exact KPI:s you need to follow up. Here we have the production with the expected number of units produced, actual outcome and a gauge to visualize how you are doing. As with the safety cross, each team can fill in its own figures, which are then automatically escalated or aggregated into a common picture for the whole unit or the entire operation.

Happens at Boards on Fire
Free web demo