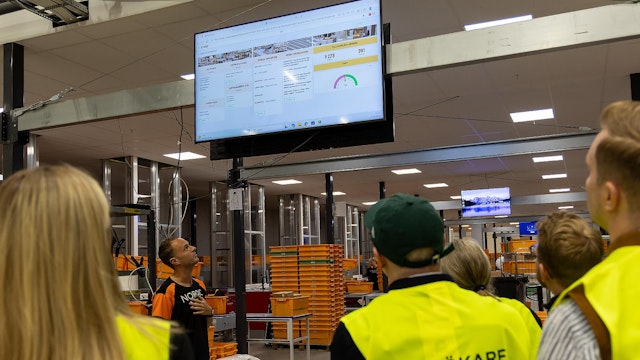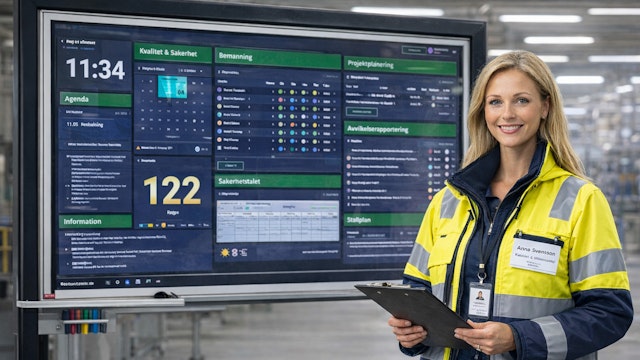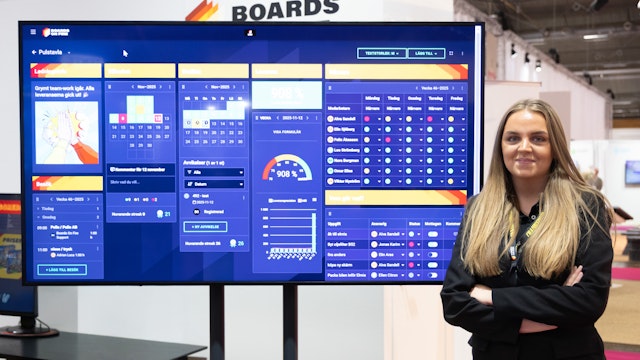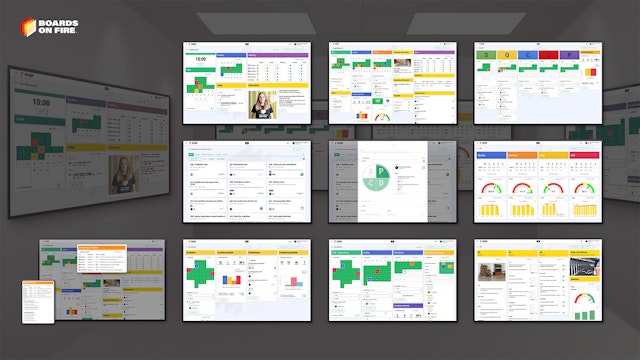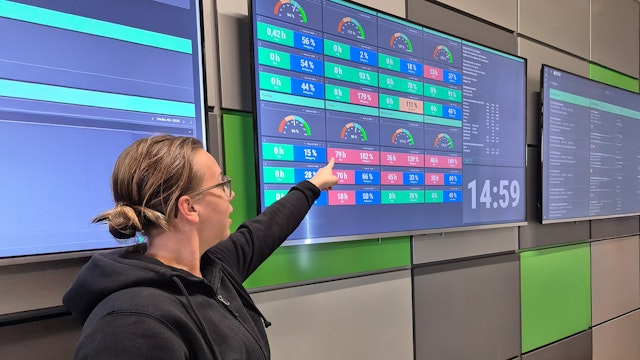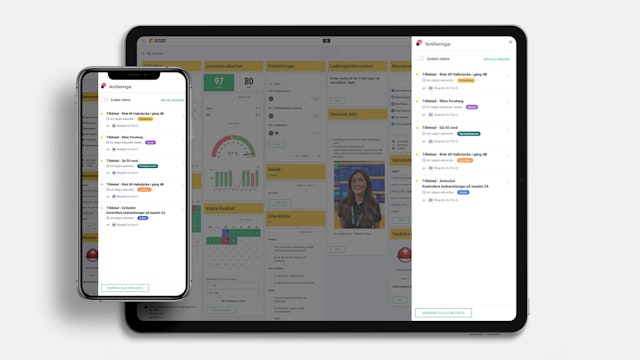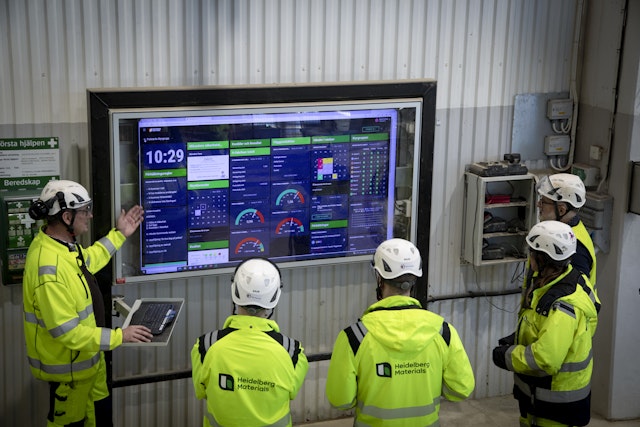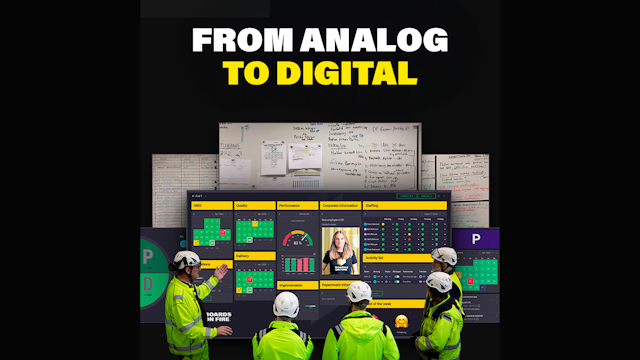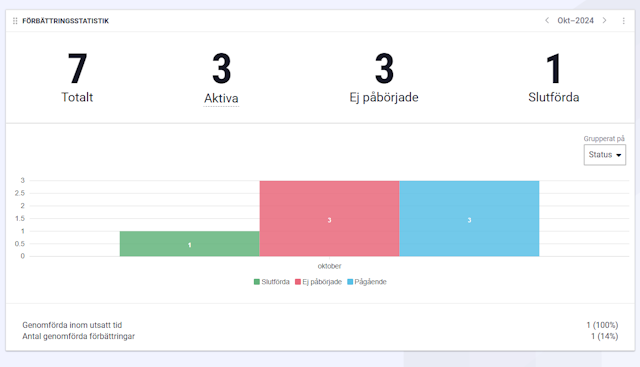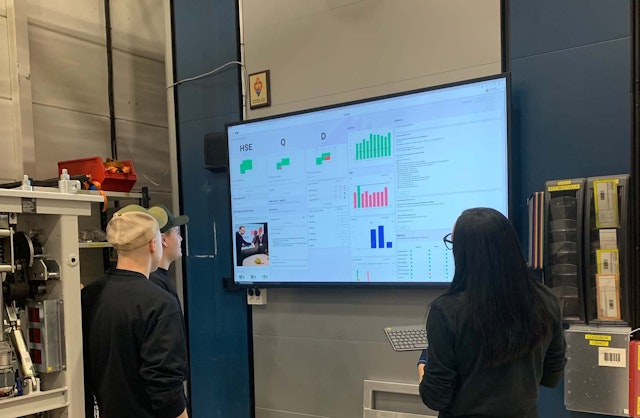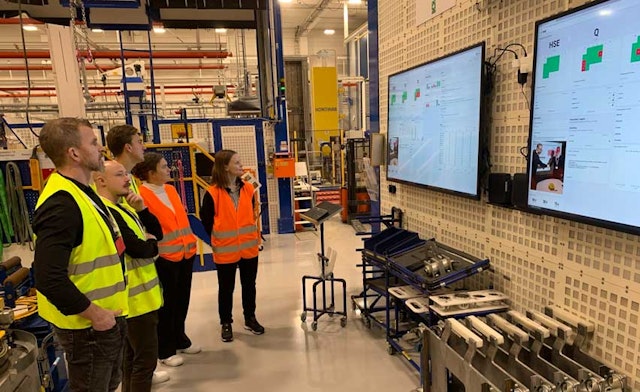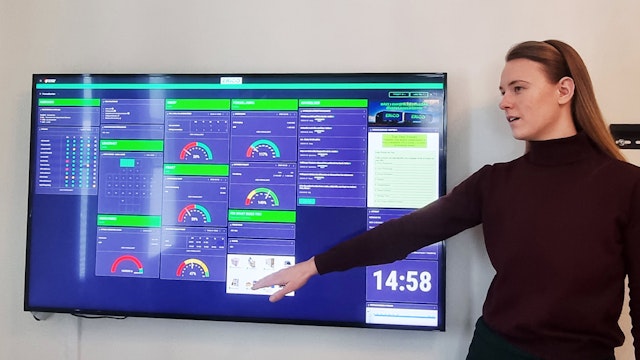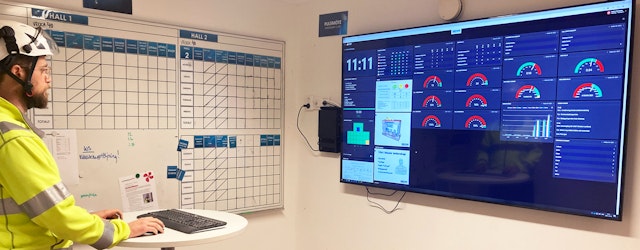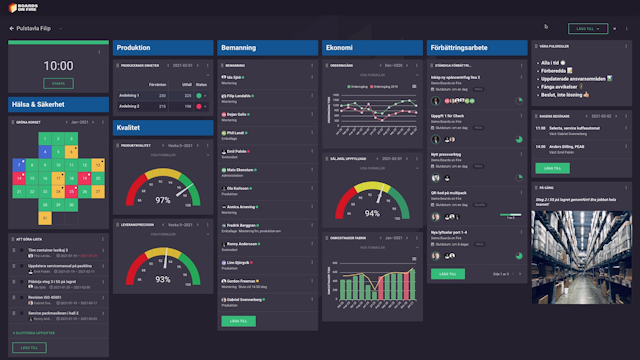
Digital dashboards that help you identify deviations and make the right decisions.

Capture your deviations and turn them into improvements
Continuous improvement, Kaizen boards, PDCA and other tools.
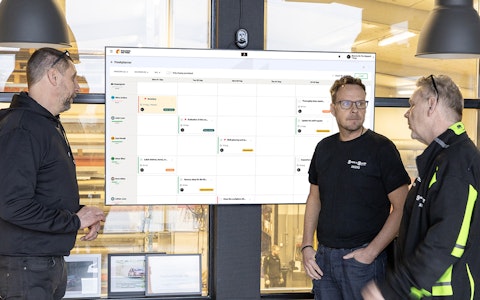
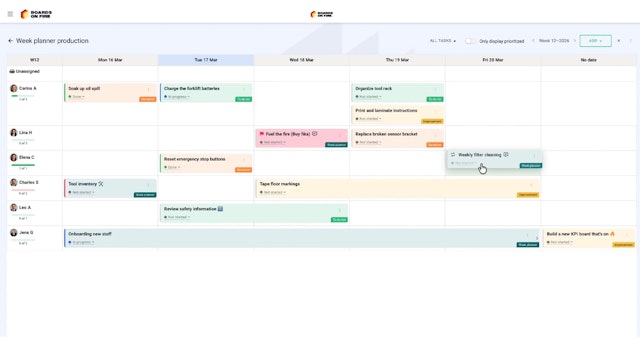
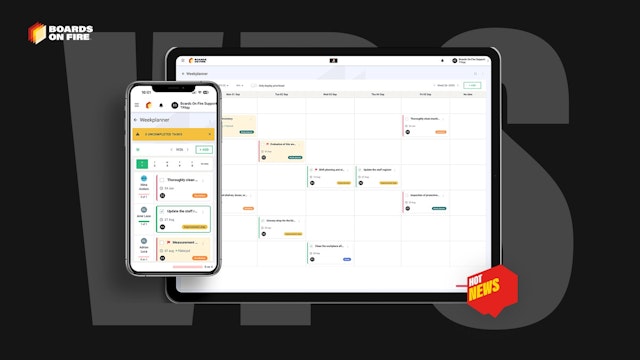
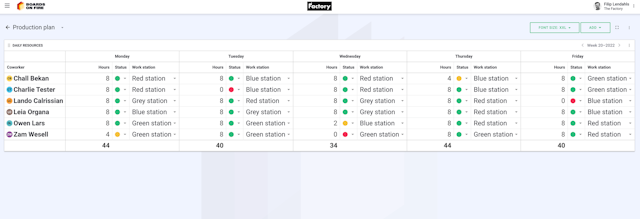
All your team’s tasks, neatly organized in one weekly view.
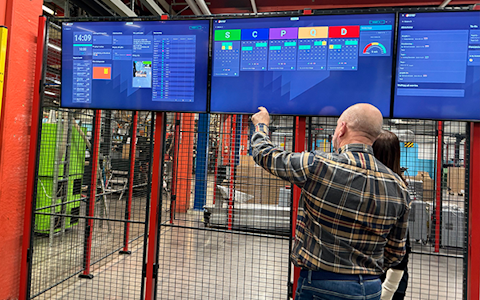
Improve key performance indicators within your specific focus areas with our SQCDP board.

Use the PDCA cycle as a tool to improve both quality and processes
Digital tools for 5S work, recurring audits, and a well-organized workplace.
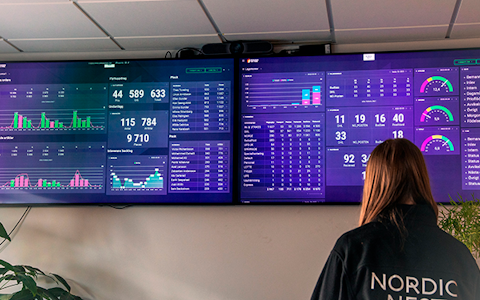
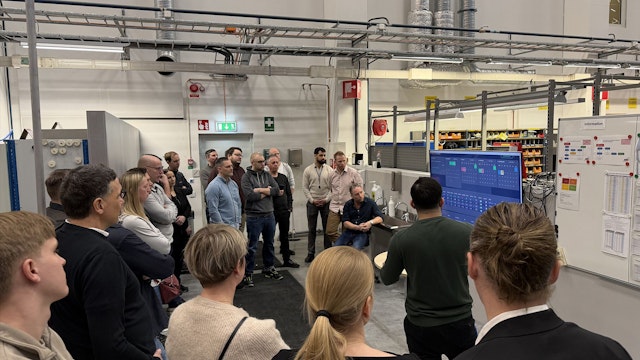
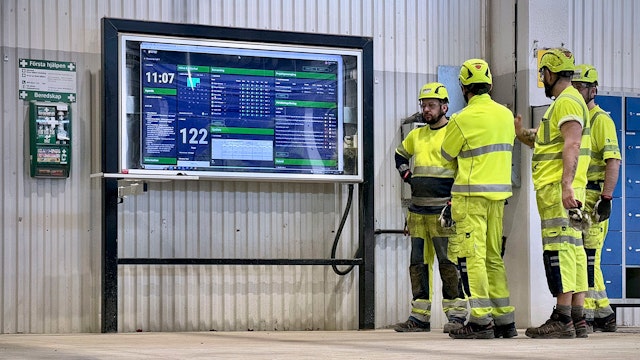
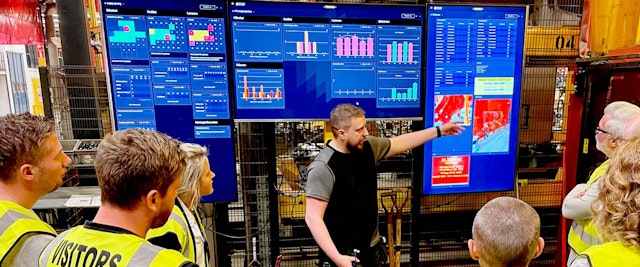
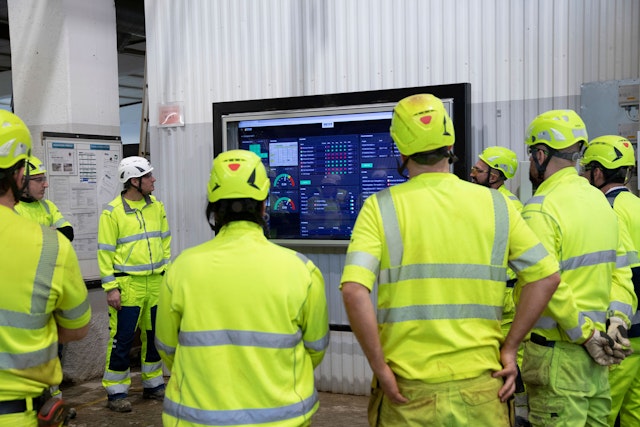
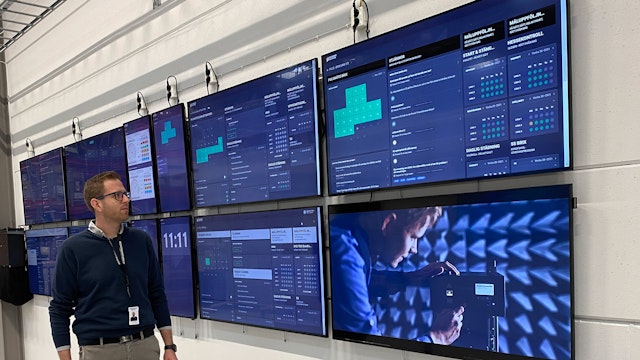
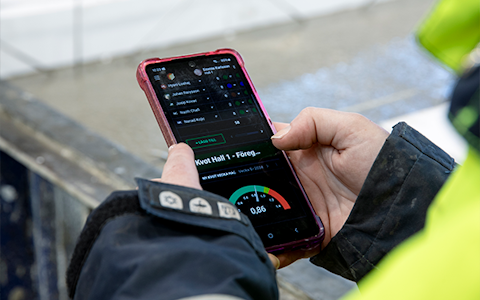
Visualize KPIs and communicate effectively throughout the entire organization.

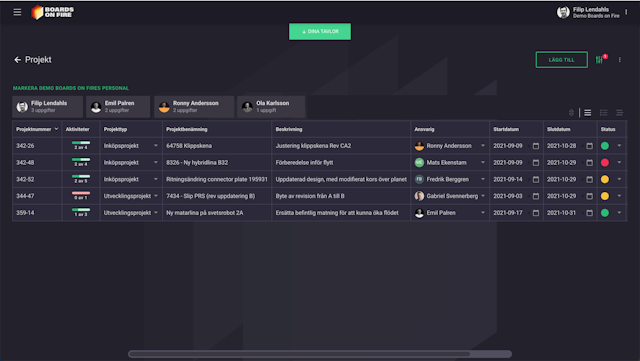
Basic project management and activity boards.
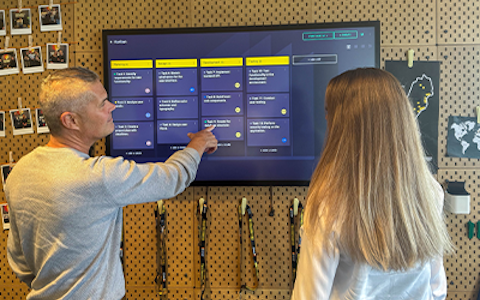
Kanban is a powerful method for visualizing, managing, and optimizing workflows.

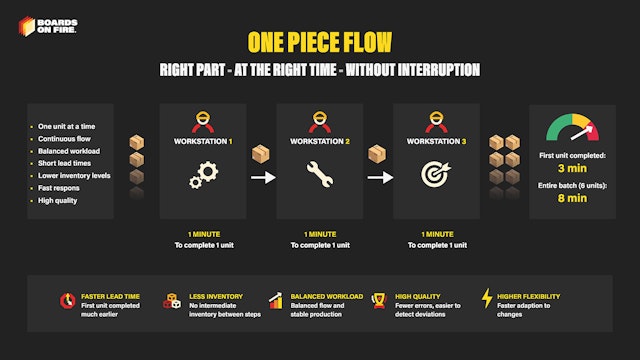
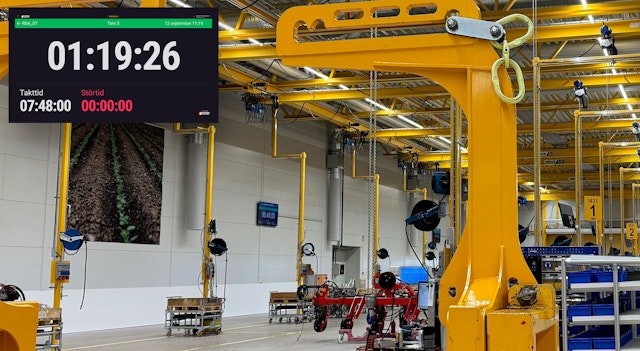
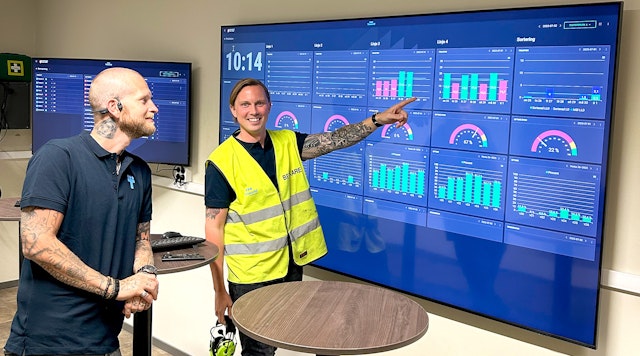
Digital dashboards for takt time flow with takt time counter and stop time log.

Digital visitor registration provides full control over all planned and executed visits to your business.
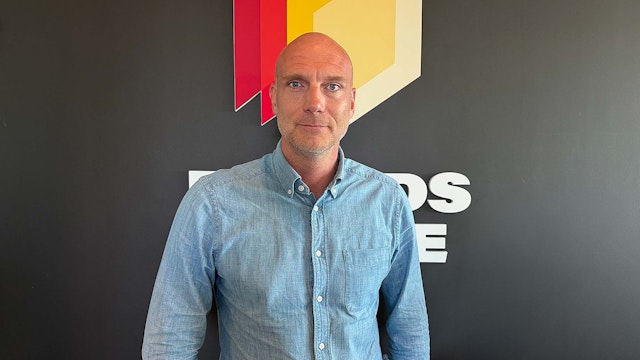
Today, Johan Thomélius from our partner Brignite Coaching is guest blogging about the power of visual tools. In this post, he shares his insights on how these tools can simplify the management of complex information and help businesses achieve their goals more efficiently.
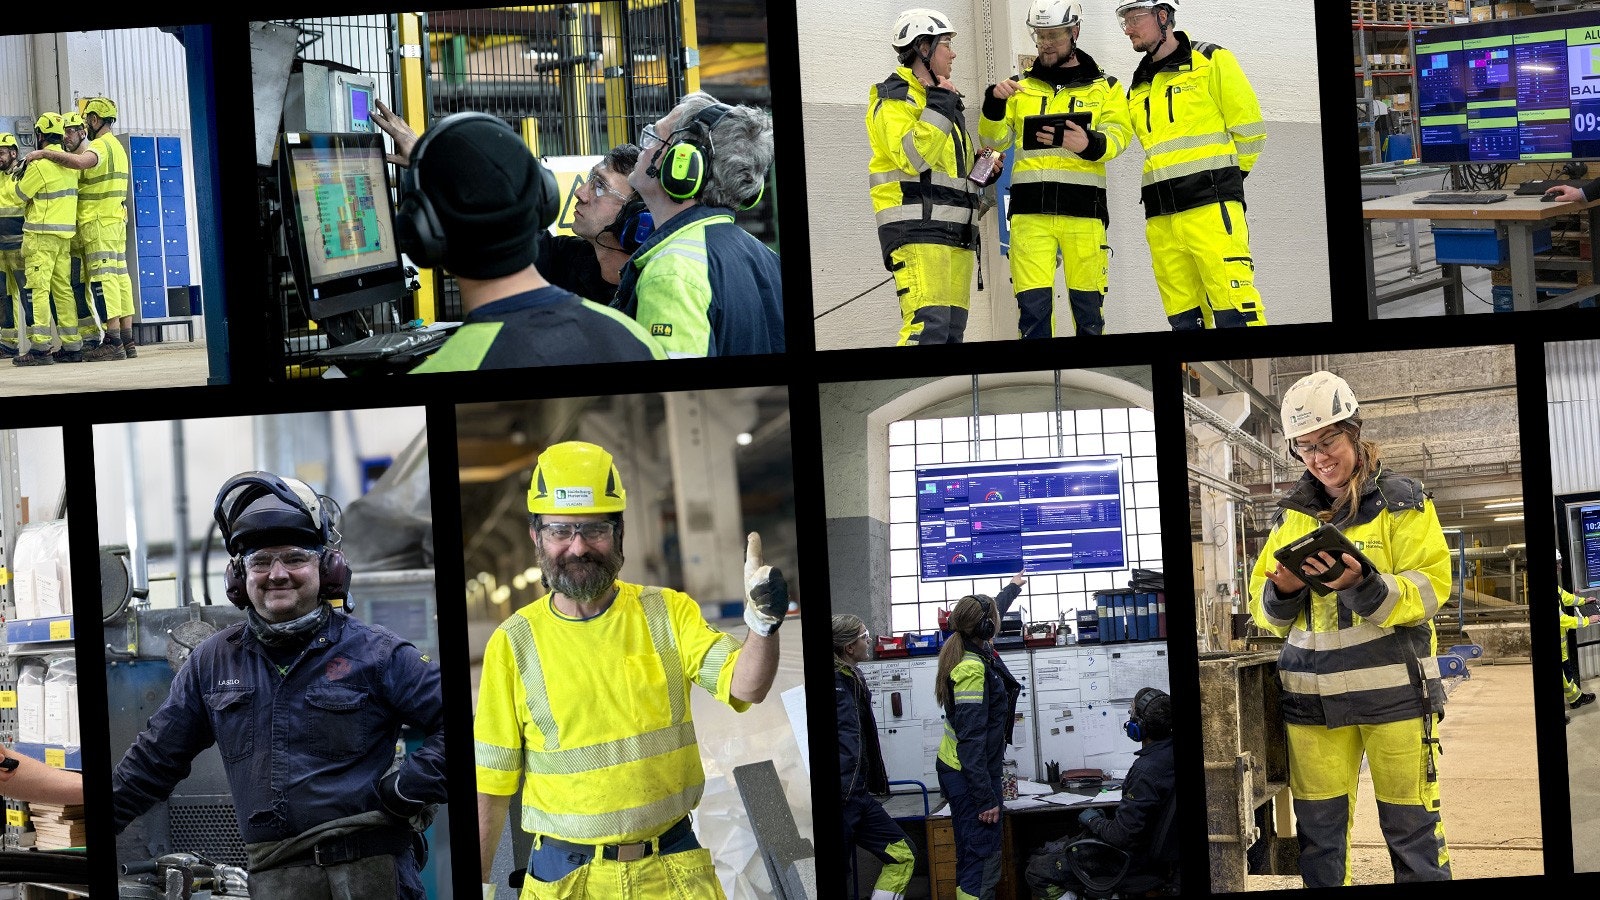
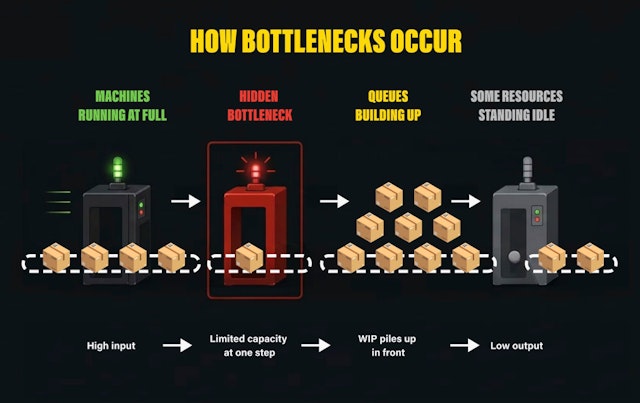
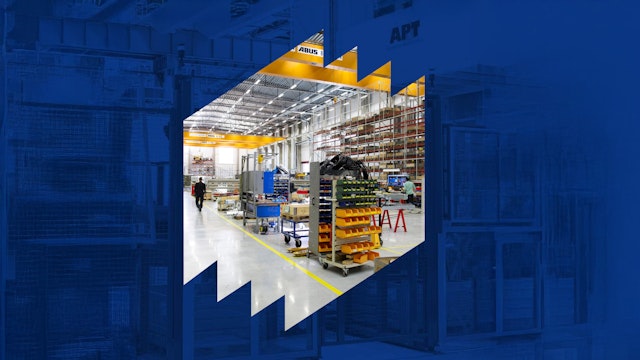
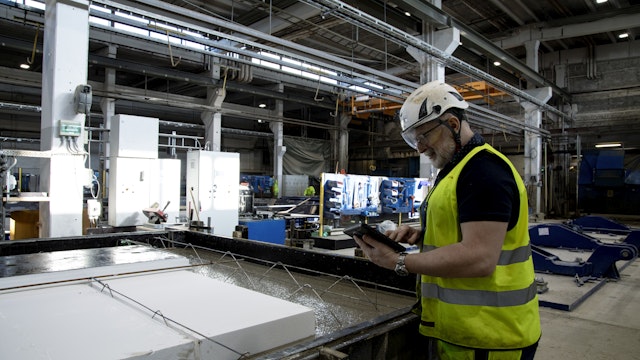
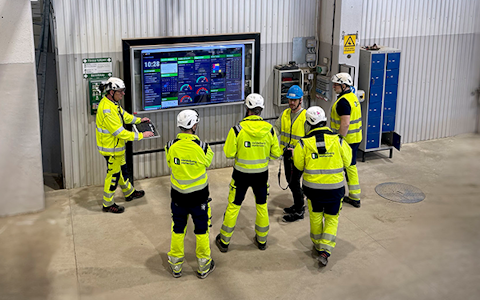
“When the blind lead the blind, both fall into the pit.” This biblical quote highlights something crucial, especially for manufacturing industries – if you can’t see where you’ve been and where you’re going, you’ll soon find yourself in a ditch!
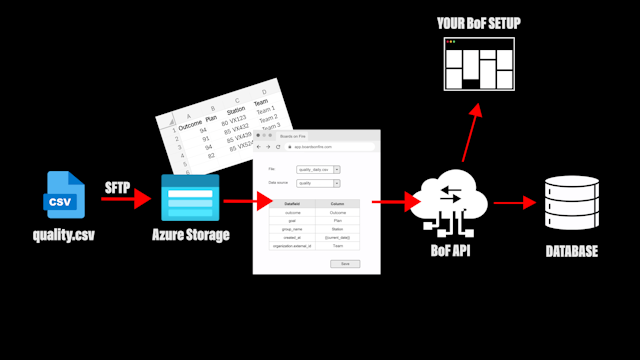
By collecting data and presenting it in an easy way for your organization, you can unlock numerous benefits:
In summary, in an industrial environment where speed, precision, and collaboration are key, visualization can be a powerful tool for creating a more engaged and motivated workforce.

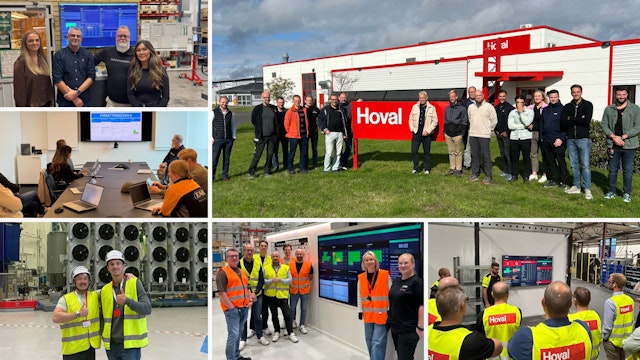
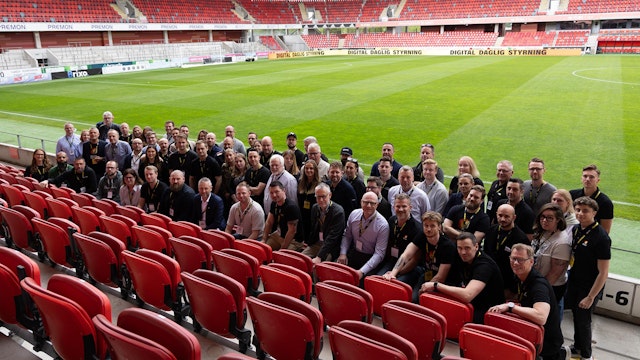
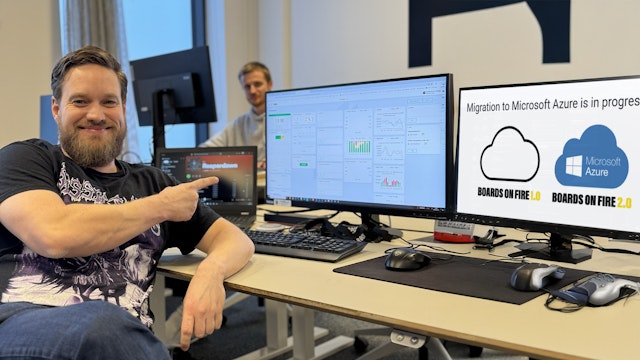
Happens at Boards on Fire
Free web demo