
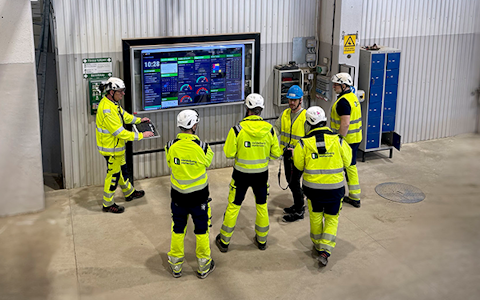
Digital dashboards that help you identify deviations and make the right decisions.
Continuous improvement, Kaizen boards, PDCA and other tools.
Capture your deviations and turn them into improvements

Real-time control for takt-based production. Detect disruptions as they happen, respond faster, and keep production on pace.

Integrate Boards on Fire with ERP, MES, OEE, Power BI and other systems. Automate data flows, reduce administration and act faster.
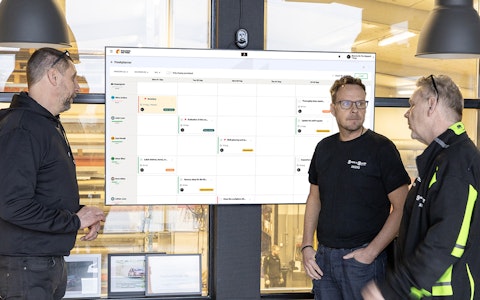
All your team’s tasks, neatly organized in one weekly view.
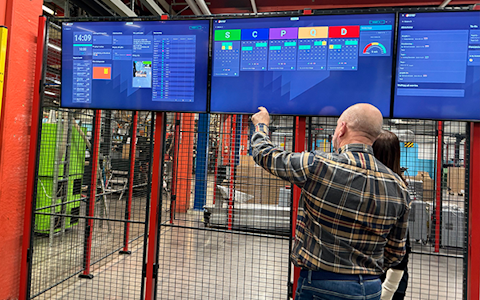
Improve key performance indicators within your specific focus areas with our SQCDP board.
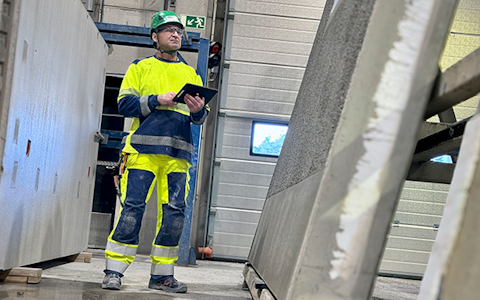
Use the PDCA cycle as a tool to improve both quality and processes
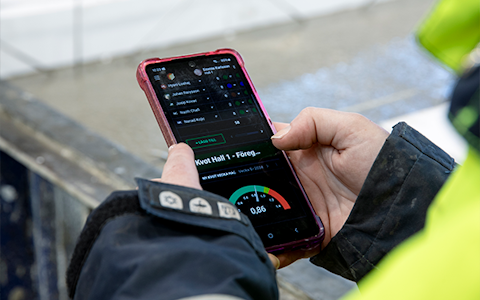
Digital tools for 5S work, recurring audits, and a well-organized workplace.
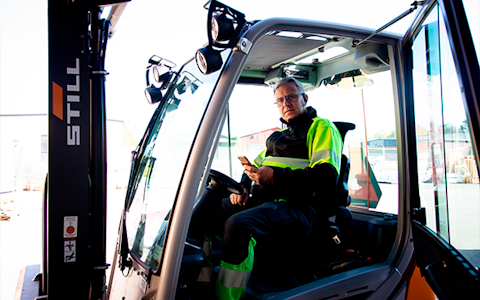
Basic project management and activity boards.
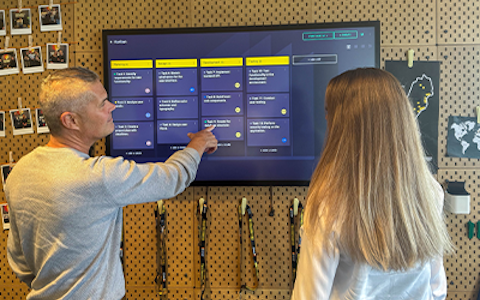
Kanban is a powerful method for visualizing, managing, and optimizing workflows.
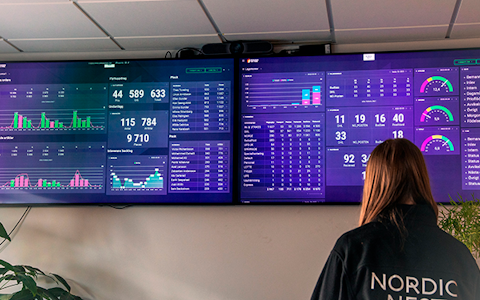
Visualize KPIs and communicate effectively throughout the entire organization.
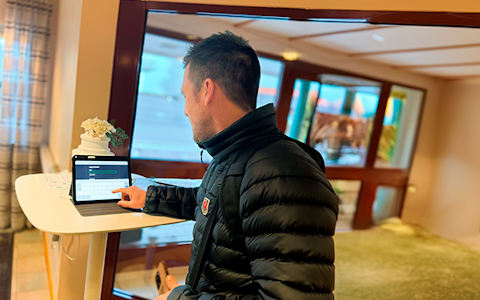
Digital visitor registration provides full control over all planned and executed visits to your business.
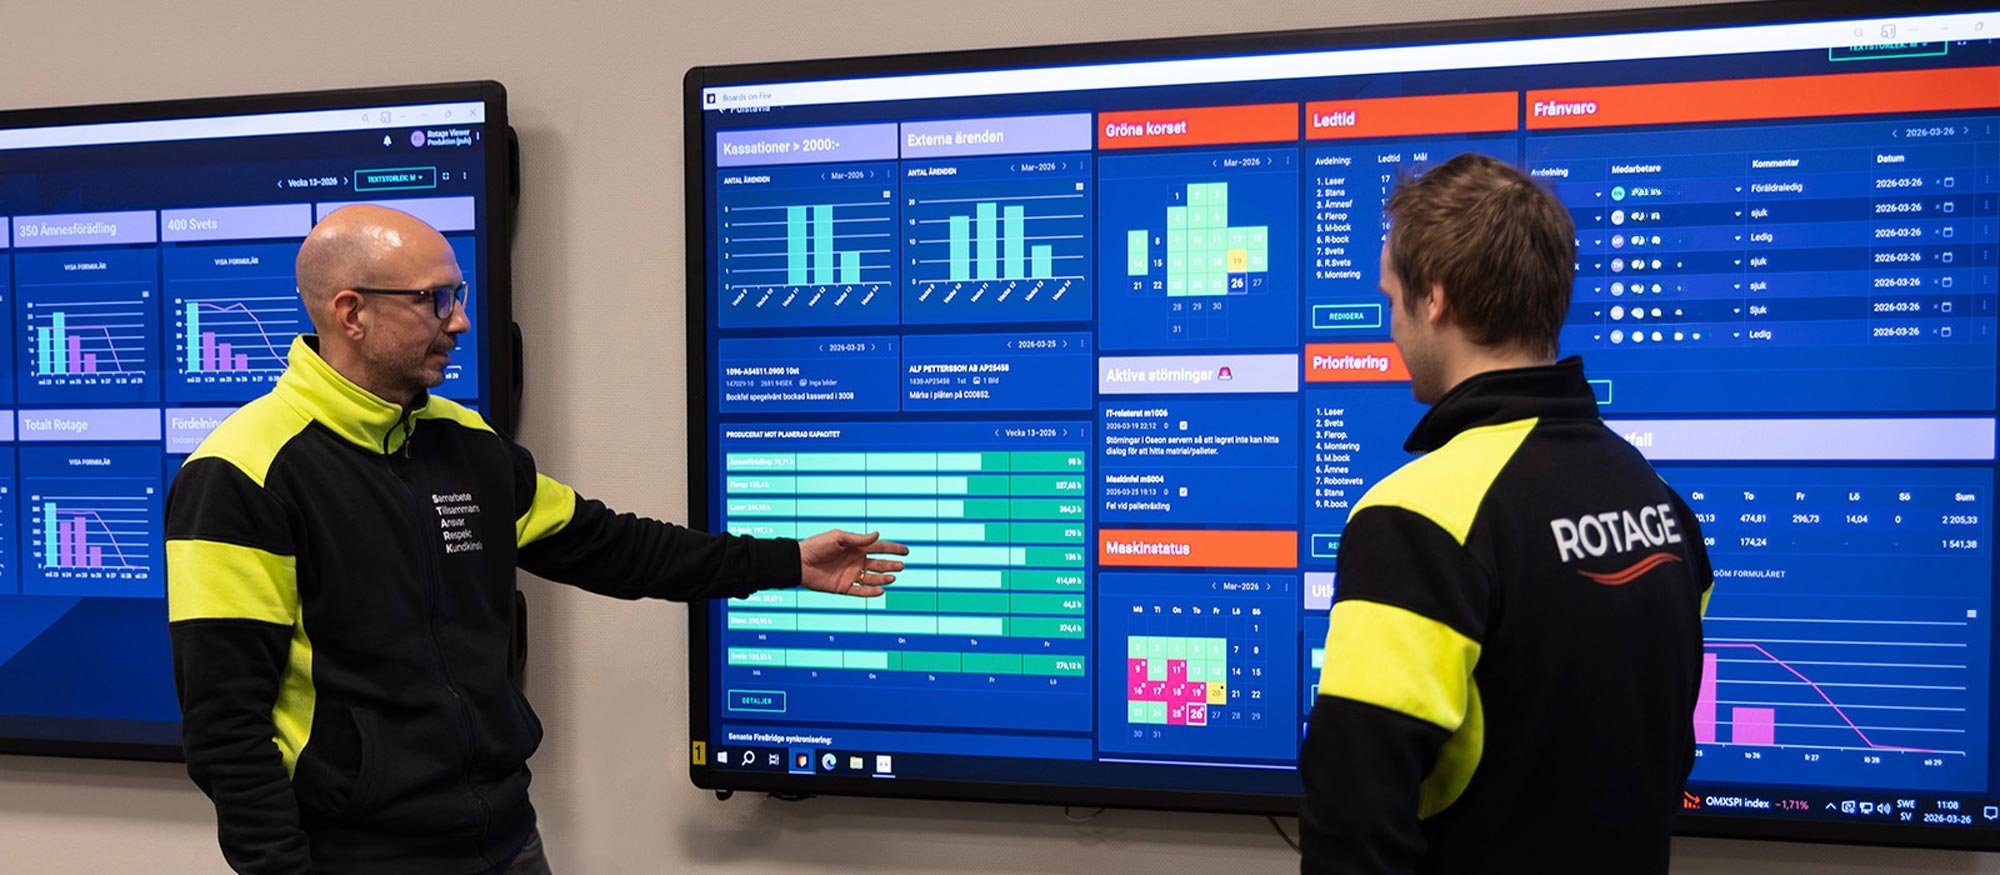
Connect Boards on Fire to ERP, MES, OEE, BI, machine and other business-critical systems. Automate data flows, visualise the right information where the work happens and make it easy for teams to take immediate action.














Valuable information is often scattered across ERP systems, production systems, machines, reporting tools and other parts of the organisation. When it has to be collected, compiled and transferred manually, follow-up becomes time-consuming – and decisions risk being based on yesterday’s figures.
With Boards on Fire integrations, relevant data flows automatically to the boards where teams, managers and support functions work every day. KPIs, production results, stoppages, deviations, order status and other operational data become clear, current and accessible to the right people.
Boards on Fire does not replace your existing systems. We make the information in them more useful for daily management.
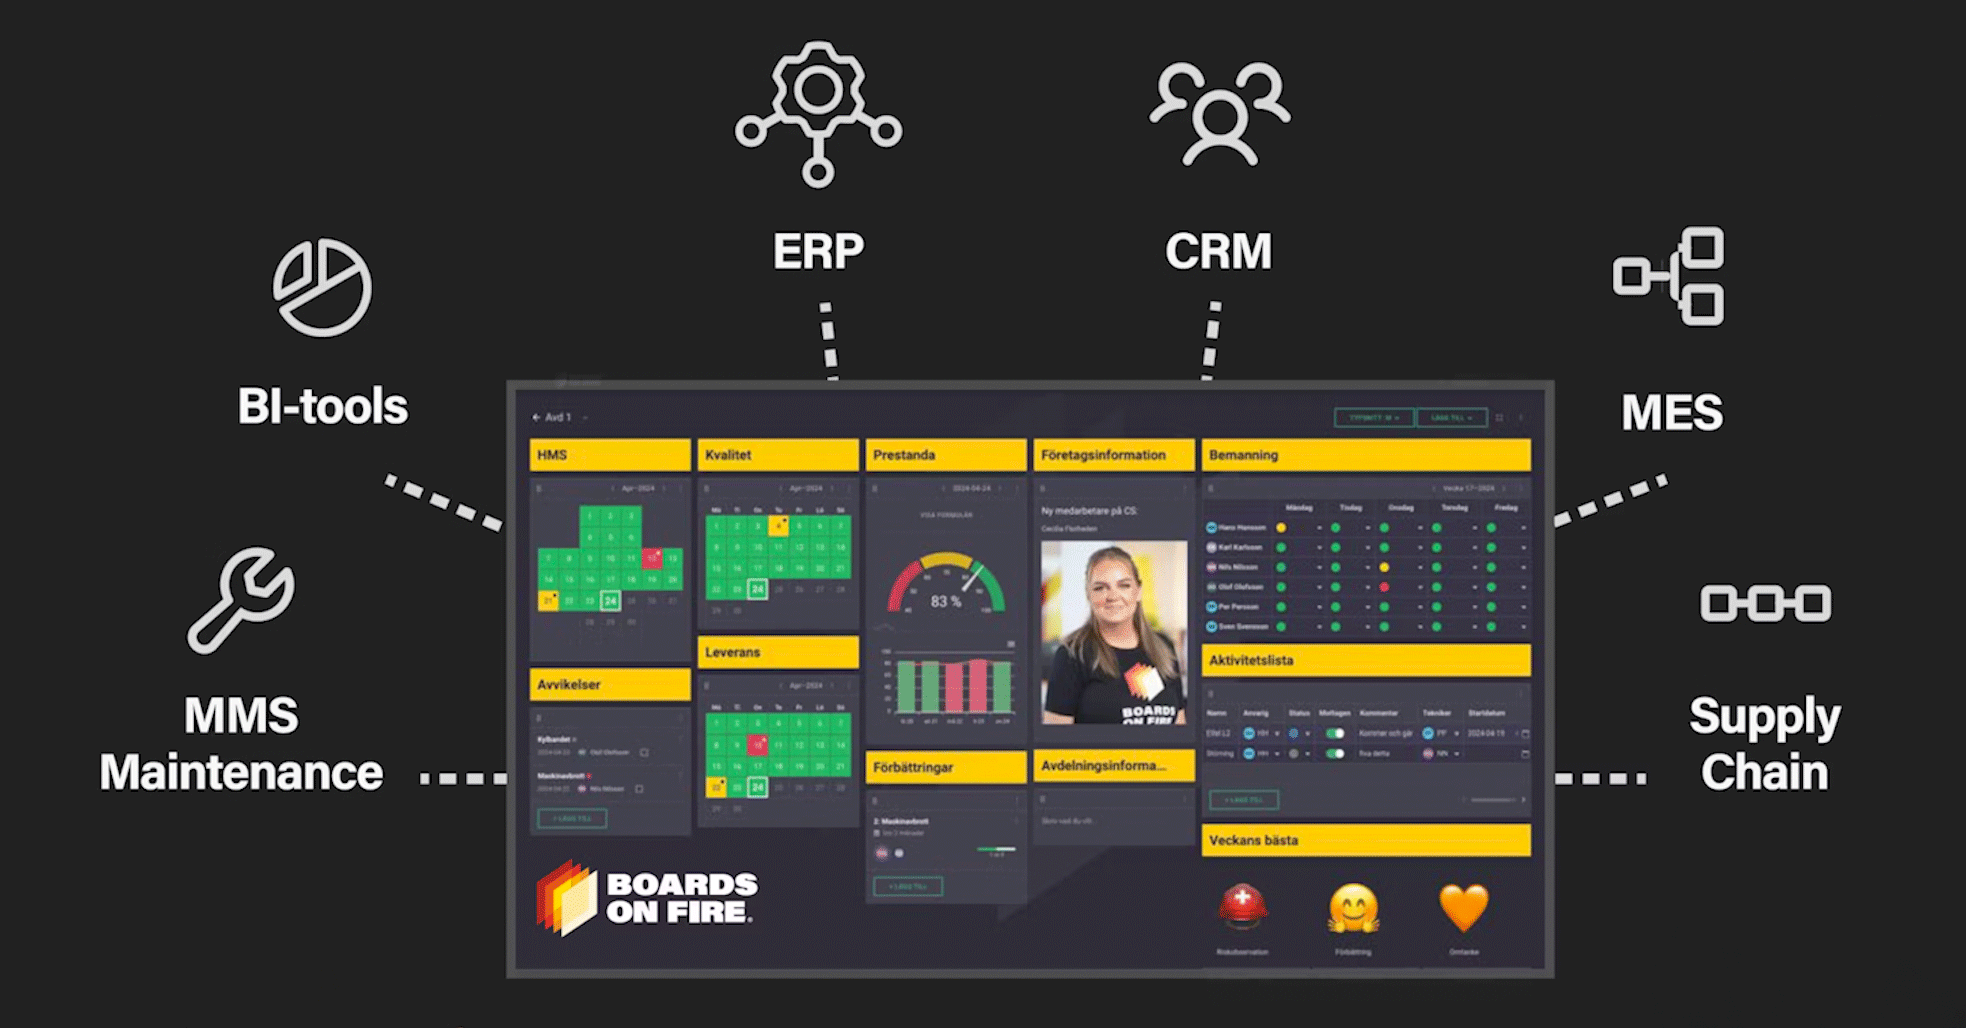
Bring relevant information from multiple systems into one visual view. Everyone works from the same data and can quickly see what is going according to plan, what is deviating and where support is needed.
Stop copying figures between systems, updating spreadsheets and writing data on whiteboards. Automated flows reduce duplicate work and dependence on individual employees, freeing up time for analysis, problem-solving and improvement.
Boards on Fire is more than a dashboard. When the data reveals a problem, the team can immediately create a deviation, assign an activity or start an improvement initiative and follow up on the result within the same way of working.
Different systems, data volumes and update requirements call for different solutions. That is why Boards on Fire offers several ways to integrate – from straightforward file uploads to flexible API connections and ready-made integrations.
|
The Boards on Fire REST API makes it possible to read, create, update and delete data. Endpoints and documentation are generated based on how your data sources and entities are structured, allowing the integration to be adapted to your specific environment. The API is suitable when you want to build a tailored connection to an ERP system, production system or your own application, for example.
Learn more about the Boards on Fire REST API >>
|
Boards on Fire also offers ready-made connections for specific systems and use cases.
The IA system
Transfer near misses, accidents, risk observations and safety observations to the relevant board. This makes health and safety issues visible in daily management and helps teams respond and follow up more quickly. Learn more about the IA integration >>
Cognite
Connect events and sensor data from Cognite Data Fusion with daily improvement work. Visualise data such as stoppage causes, temperature, pressure, speed or energy consumption, and create actions directly from the data. Learn more about the Cognite integration >>
Free web demo
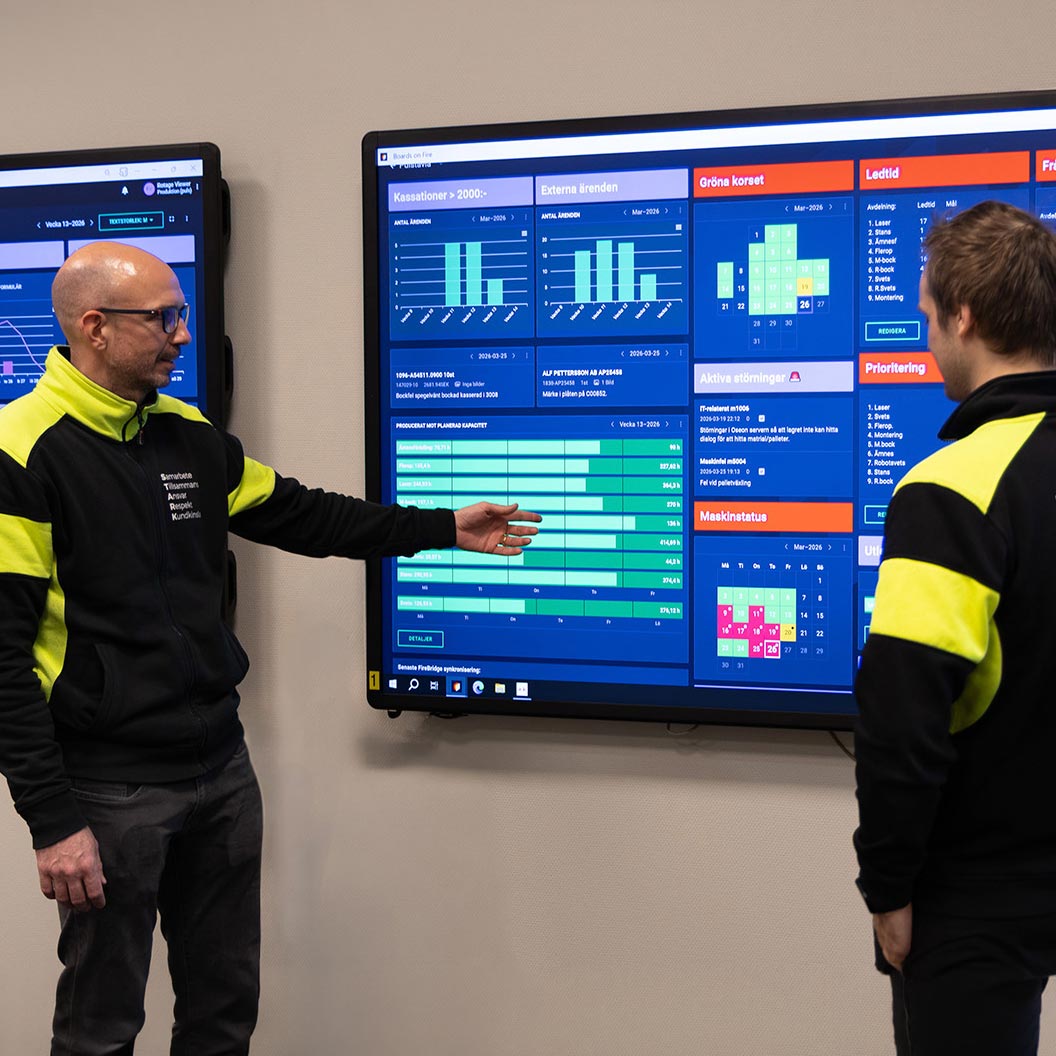
At Rotage, important production data was already available in the Monitor ERP system, but the information was difficult for everyone to access and use in their daily work. Figures were written by hand on whiteboards and taken from Excel printouts. When key employees were absent, updates risked coming to a halt.
By integrating Monitor with Boards on Fire, the data flow was automated. Production results, capacity utilisation, changeover time and planned time are now clearly visualised on each department’s boards. The information is updated approximately every 10 to 15 minutes, giving teams current information for meetings, decisions and improvements.
|
|
|
|
|
|
|
|
|


