
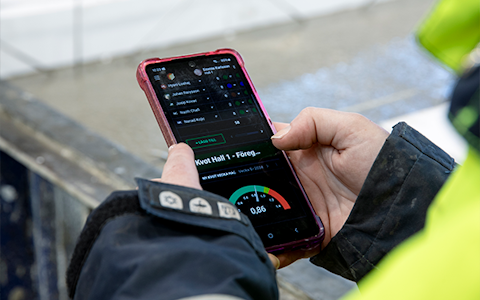
Digital dashboards that help you identify deviations and make the right decisions.

Capture your deviations and turn them into improvements

Continuous improvement, Kaizen boards, PDCA and other tools.
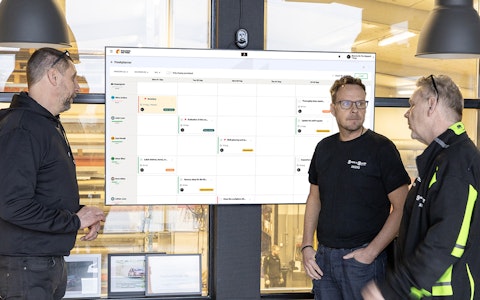
All your team’s tasks, neatly organized in one weekly view.
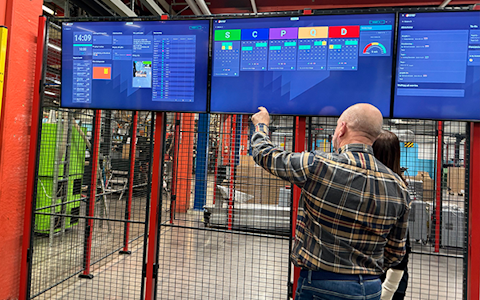
Improve key performance indicators within your specific focus areas with our SQCDP board.

Use the PDCA cycle as a tool to improve both quality and processes
Digital tools for 5S work, recurring audits, and a well-organized workplace.
Visualize KPIs and communicate effectively throughout the entire organization.

Basic project management and activity boards.

Kanban is a powerful method for visualizing, managing, and optimizing workflows.

Digital dashboards for takt time flow with takt time counter and stop time log.

Digital visitor registration provides full control over all planned and executed visits to your business.
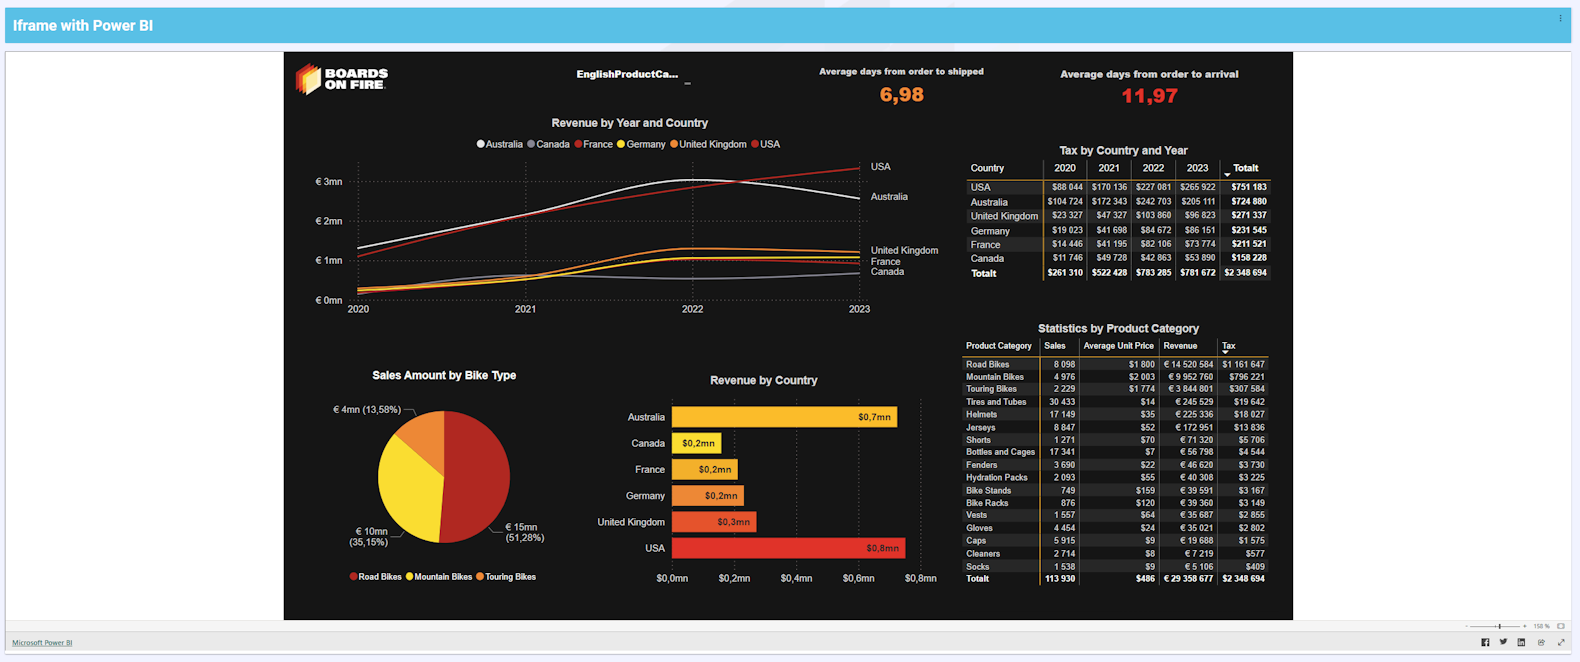
1. Display your Power BI reports in your existing boards via the Iframe component. Make your reports public for users logged into BoF and embed the URL from the reports into our Iframe component. It's through the report settings that you determine what will be visible in BoF.
The Iframe component can be moved around on all boards, in all sizes, just like our other components. The reports become interactive; you can click around, zoom in/out, and navigate between pages. Choose to display specific reports in production while others are only shown on, for example, purchasing and management boards.
A disadvantage of only displaying Power BI reports in BoF this way is that you cannot act on the data, as it is merely displayed and not stored in our system. Our alternative method for visualizing data from Power BI and also acting on it is explained in the next section.
2. Integrate the data you want from Power BI into BoF via Microsoft Power Automate.
It's easy to send desired data from your Power BI report to BoF via Microsoft Power Automate. It offers a relatively simple interface for automatically scheduling data transfers.
Once the data is in BoF, you can use it everywhere, just as if it were manually entered. You can create activities, deviations, disturbances, and improvements based on this data in BoF, which is an advantage over the suggestion above where you only view the report. It simply depends on your needs, and in the final section, we exemplify this with a use case.
Visualize data coming from Power BI in graphs, gauges, forms, and numerical visualizations. Aggregate it to get summarized views, group it at different intervals to follow trends such as monthly or rolling 12-month periods.
Our integration video will help you get started with Power Automate from Power BI here.
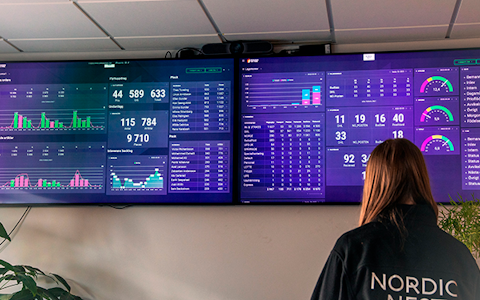
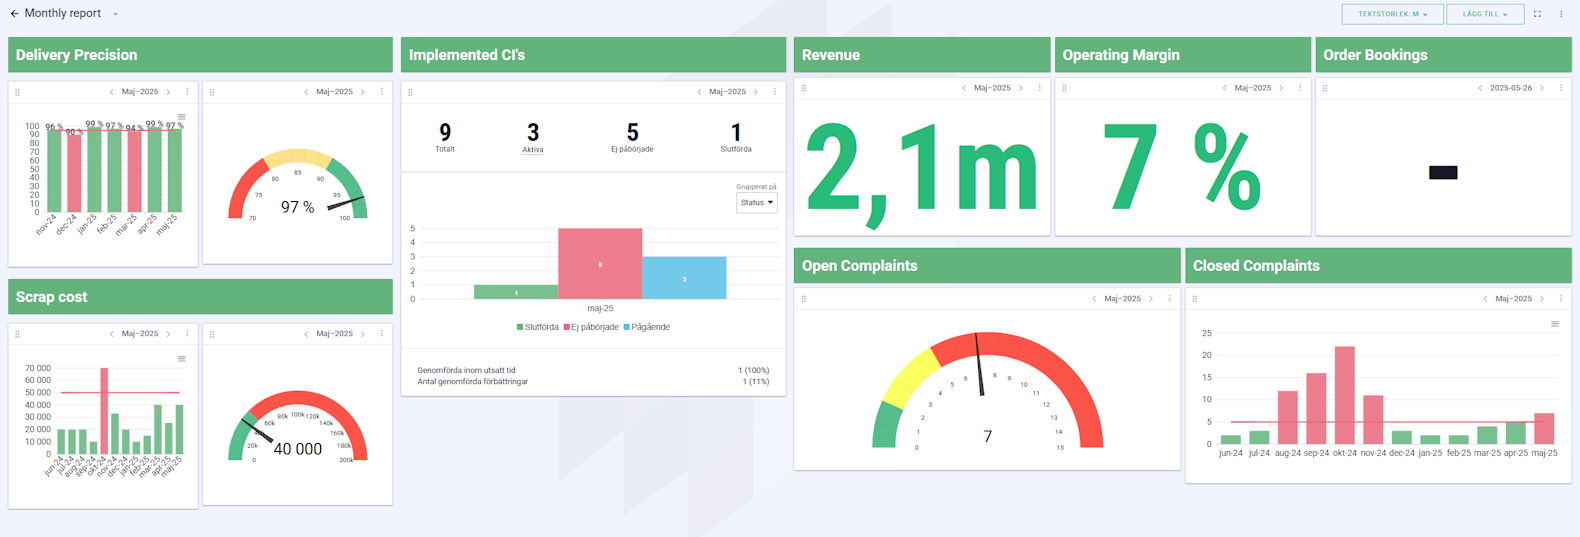
Here's how data from Power BI can look in BoF if integrated (and visualized with our components) as a monthly report:
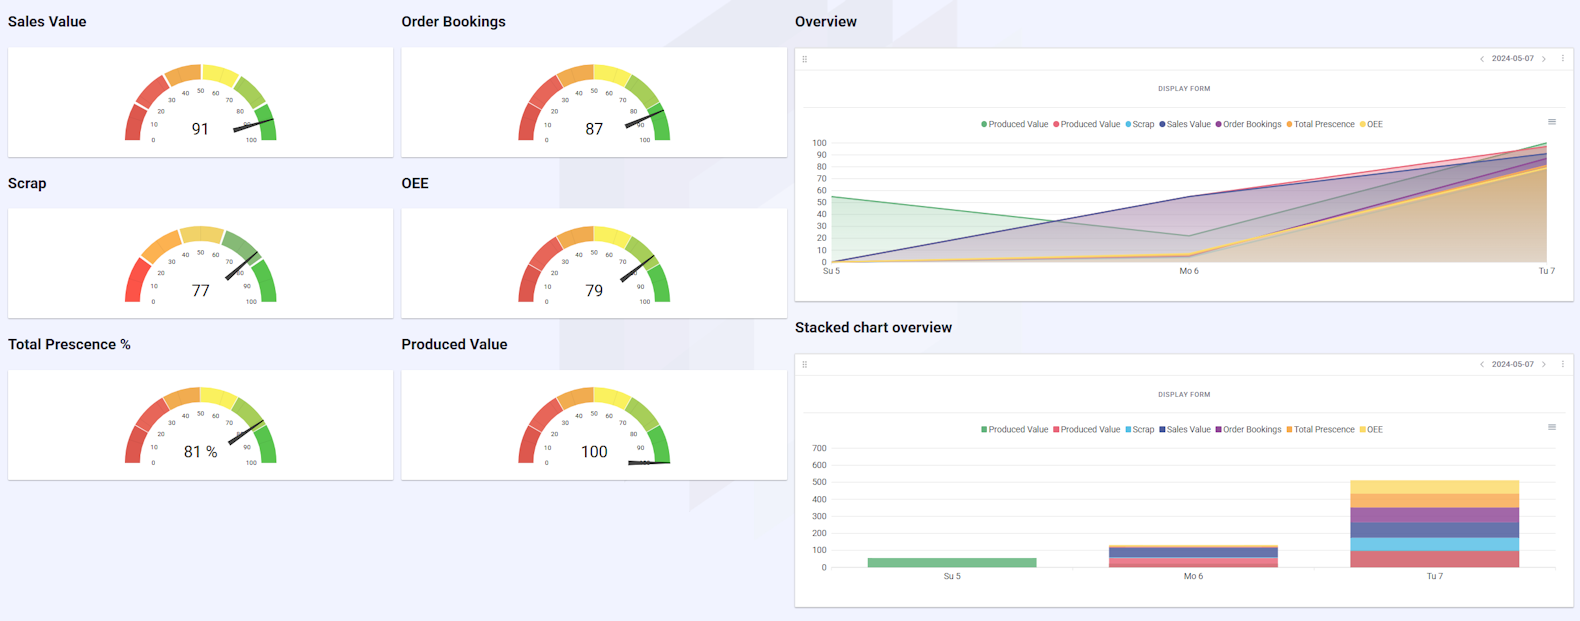
Here's another example of how you can build a report with data from Power BI in BoF:
Based on all this data now available in Boards on Fire, you can easily create activities. Here's a common user scenario:
We see that we are in the red regarding our claims handling. The data has come in from Power BI and is visualized in this example on a monthly basis in a gauge. Based on this, we can easily create a deviation or improvement and work further to improve our operations. In this case, we choose to create a deviation.
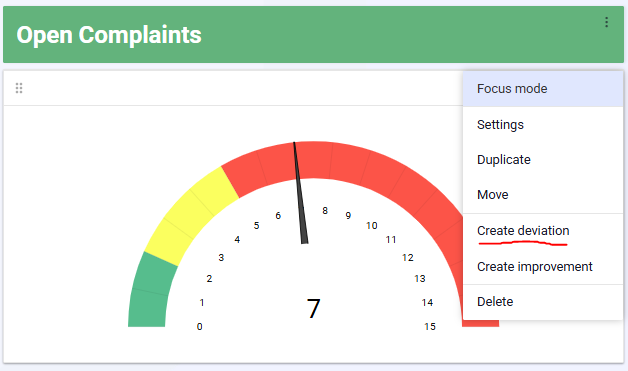
The data we are looking at in the gauge, and from which of our departments it originates, is automatically included in our deviation.
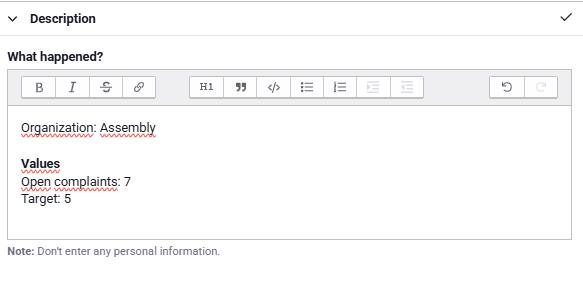
Then it's up to you to continue working with the deviation, create actions, and improvements as needed. Read more about our deviation management and improvement activities in the related sections below.
To easily get started with Power BI integration, please contact our support for more information and help!
Free web demo