
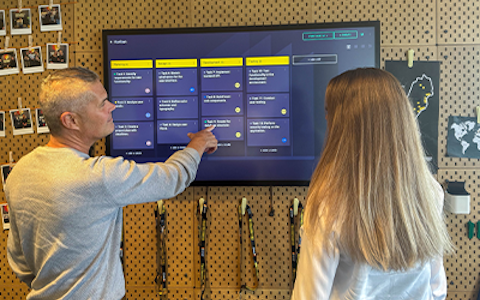
Digital dashboards that help you identify deviations and make the right decisions.

Capture your deviations and turn them into improvements

Continuous improvement, Kaizen boards, PDCA and other tools.
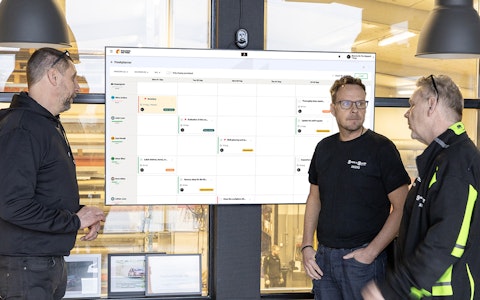
All your team’s tasks, neatly organized in one weekly view.
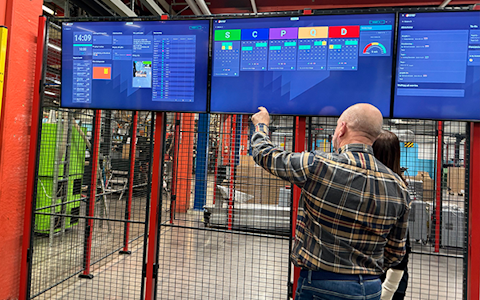
Improve key performance indicators within your specific focus areas with our SQCDP board.

Use the PDCA cycle as a tool to improve both quality and processes
Digital tools for 5S work, recurring audits, and a well-organized workplace.
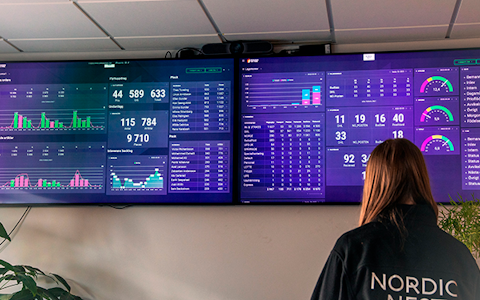
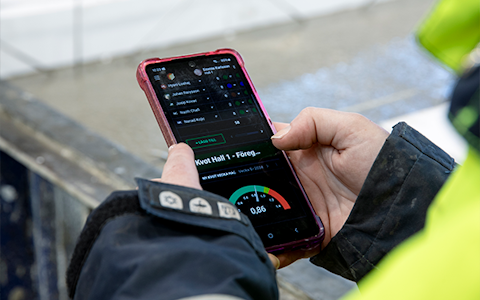
Visualize KPIs and communicate effectively throughout the entire organization.

Basic project management and activity boards.
Kanban is a powerful method for visualizing, managing, and optimizing workflows.

Digital dashboards for takt time flow with takt time counter and stop time log.

Digital visitor registration provides full control over all planned and executed visits to your business.
The recurring checklist is primarily used to create structured lists for tasks such as 5S activities, audits, questionnaires, or other routine checks. These checklists can be scheduled to be completed daily, weekly, or monthly.
The component is linked to a data source that must contain the same number of fields as the number of questions or items you want to include in the list. To create a simple checklist where tasks are marked as completed using checkboxes, the fields in the data source should be of the “boolean” type.
If you prefer to create a checklist where tasks or questions are scored, you can use the “Fields” tab to name each question or item, if this has not already been done in the data source. Here, you can also set minimum and maximum values for each question.
The “Speedometer” and “Chart” tabs provide options to visualize the checklist results through graphs and meters, linked to the scores assigned to each question or item.
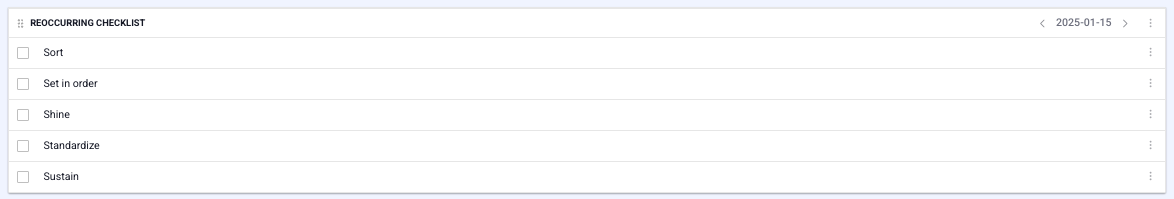
A simple checklist with fields of the “boolean” data type:
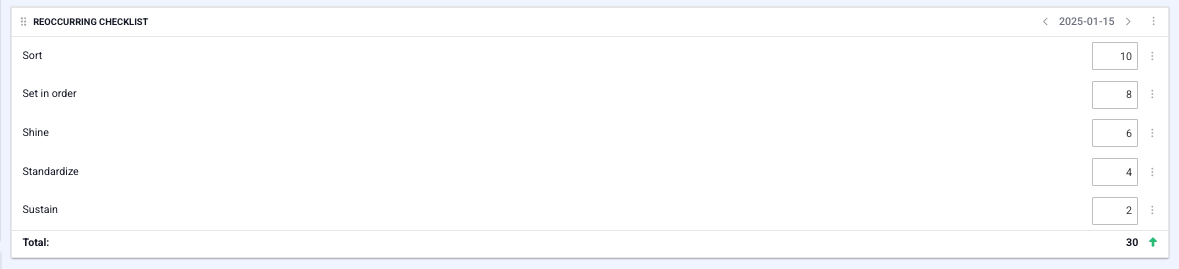
A checklist with fields of the “number” data type:
In the settings for the Recurring Checklist component, you select the desired data source and decide whether the data should be aggregated or remain within the selected organization only.
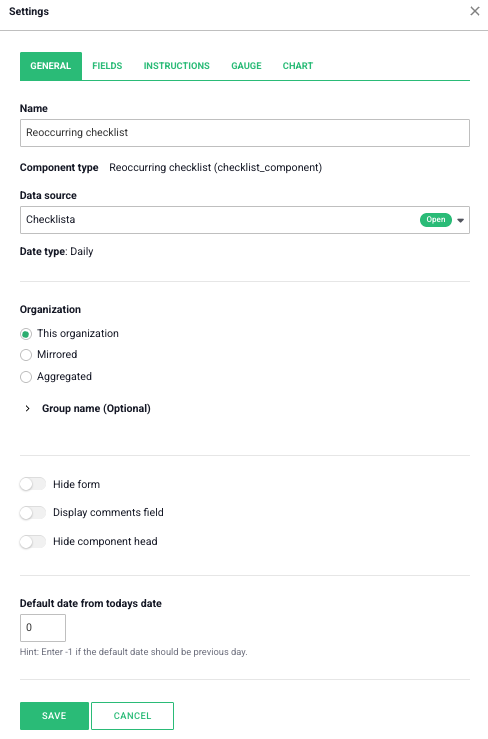
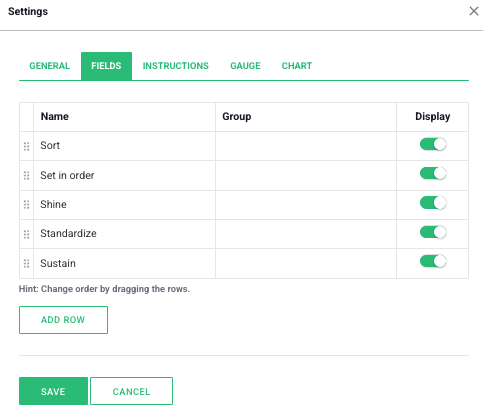
Under the “Fields” tab, you can add new fields if they have not already been created in the data source.
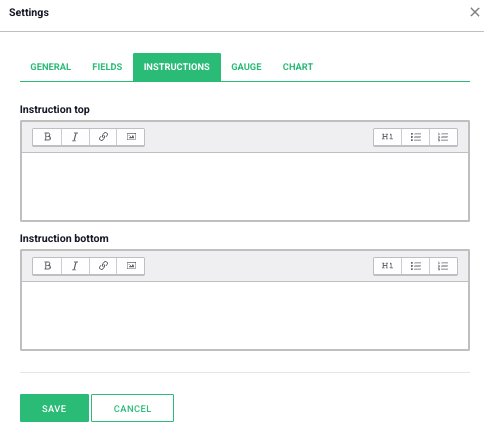
Under “Instructions”, you can add descriptions for the checklist, either at the top or bottom of it.
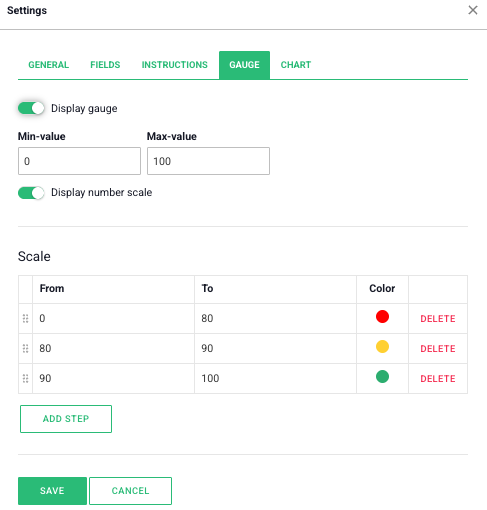
To activate an associated speedometer, navigate to the tab and select the option “Show speedometer”. Here, you can set both minimum and maximum values and choose the colors to be displayed for specific number intervals.
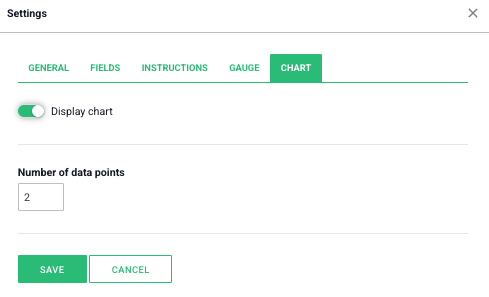
The final tab in the Recurring Checklist component is “Chart”. It is activated by selecting the option “Show chart”. In the setting for the number of data points, you can specify how many days should be included in the chart.
Free web demo