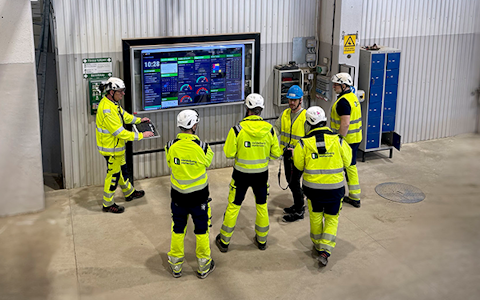
Digital dashboards that help you identify deviations and make the right decisions.

Capture your deviations and turn them into improvements

Continuous improvement, Kaizen boards, PDCA and other tools.
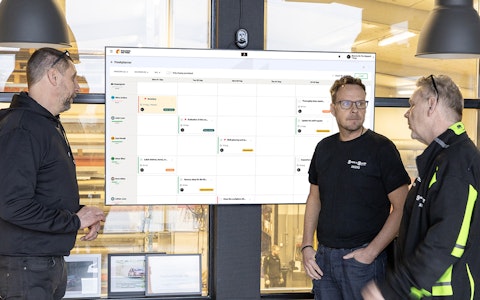
All your team’s tasks, neatly organized in one weekly view.
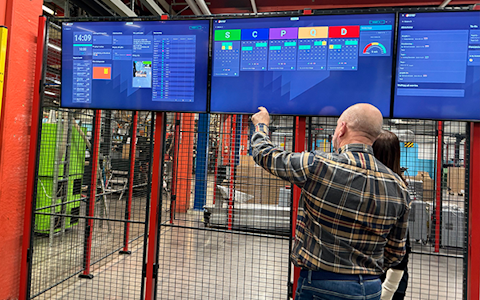
Improve key performance indicators within your specific focus areas with our SQCDP board.

Use the PDCA cycle as a tool to improve both quality and processes
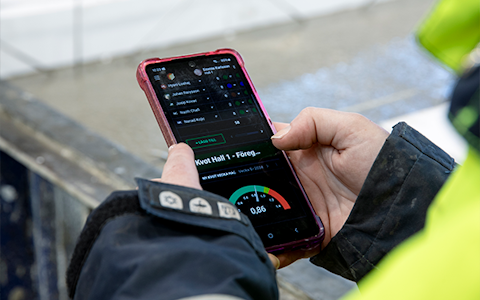
Digital tools for 5S work, recurring audits, and a well-organized workplace.
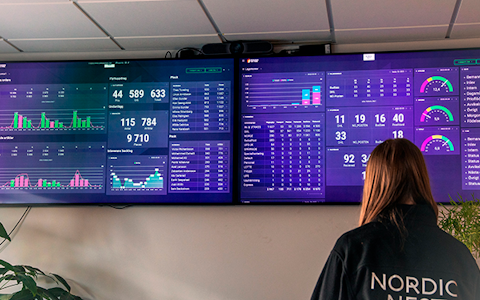
Visualize KPIs and communicate effectively throughout the entire organization.

Basic project management and activity boards.
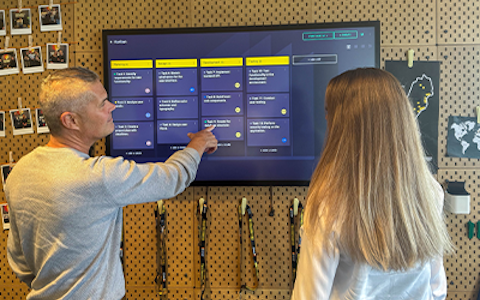
Kanban is a powerful method for visualizing, managing, and optimizing workflows.
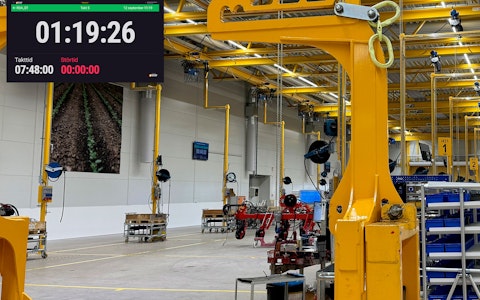
Digital dashboards for takt time flow with takt time counter and stop time log.

Digital visitor registration provides full control over all planned and executed visits to your business.
The “Simple Number Visualization” component can be used if you want to visualize a key metric in a clear and straightforward way. It is perfect for displaying important numbers, such as production figures or other measurable values. By using this component, you can provide users with quick and easy access to up-to-date data, making it easier to track and make decisions based on real-time information. The component’s design is minimalist, focusing on highlighting the specific key metric without unnecessary information or distractions.

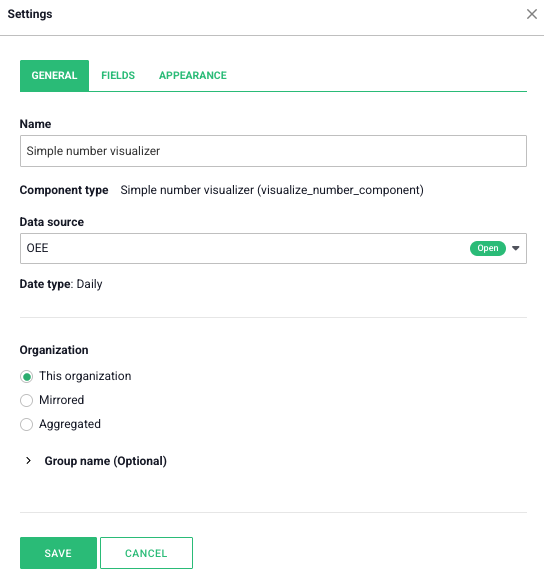
Under the component’s settings, there are three tabs:
General:
Here, you will find the “General Settings” for the component.
The settings for “Group Name” and “Organization Settings” follow the same rules as for the data component.
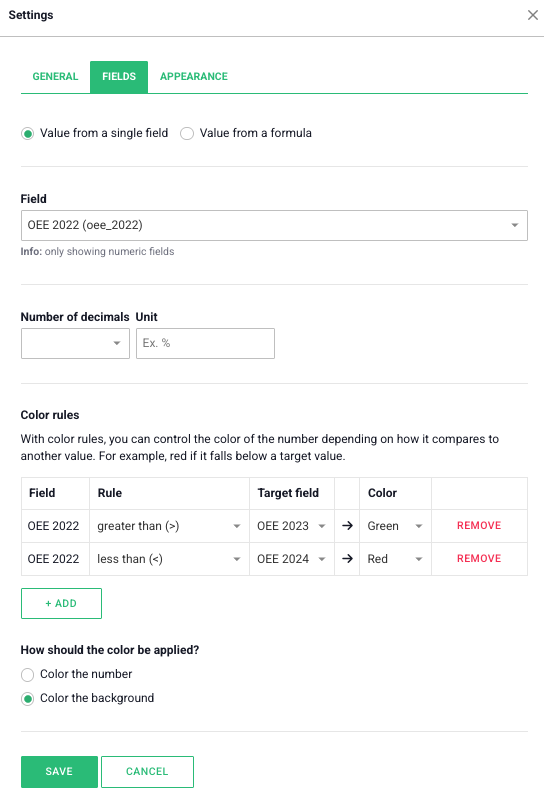
Fields:
In this tab, you choose which field from your data source you want to display.
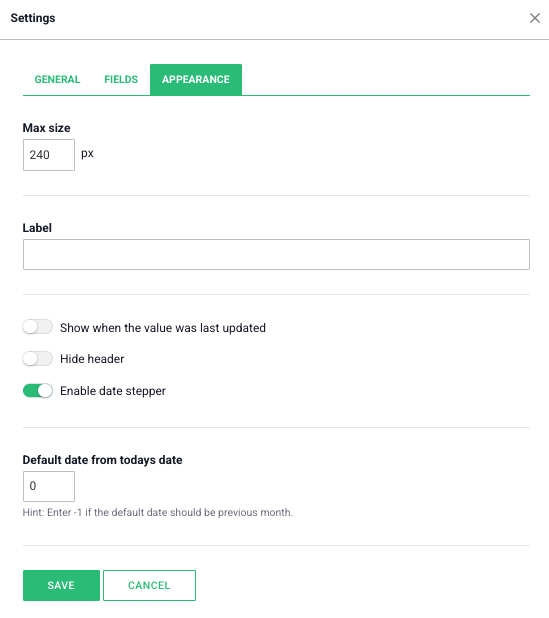
Appearance:
Here, you can adjust the appearance of the component.
Free web demo