Digital dashboards that help you identify deviations and make the right decisions.

Capture your deviations and turn them into improvements
Continuous improvement, Kaizen boards, PDCA and other tools.
All your team’s tasks, neatly organized in one weekly view.
Improve key performance indicators within your specific focus areas with our SQCDP board.

Use the PDCA cycle as a tool to improve both quality and processes
Digital tools for 5S work, recurring audits, and a well-organized workplace.
Visualize KPIs and communicate effectively throughout the entire organization.

Basic project management and activity boards.
Kanban is a powerful method for visualizing, managing, and optimizing workflows.

Digital dashboards for takt time flow with takt time counter and stop time log.
Digital visitor registration provides full control over all planned and executed visits to your business.
In Boards on Fire, there is a module that supports the organization’s improvement efforts. This module helps you structure and prioritize your improvement work in an efficient way. Improvements added to the ‘Continuous Improvements’ component are automatically displayed in this module.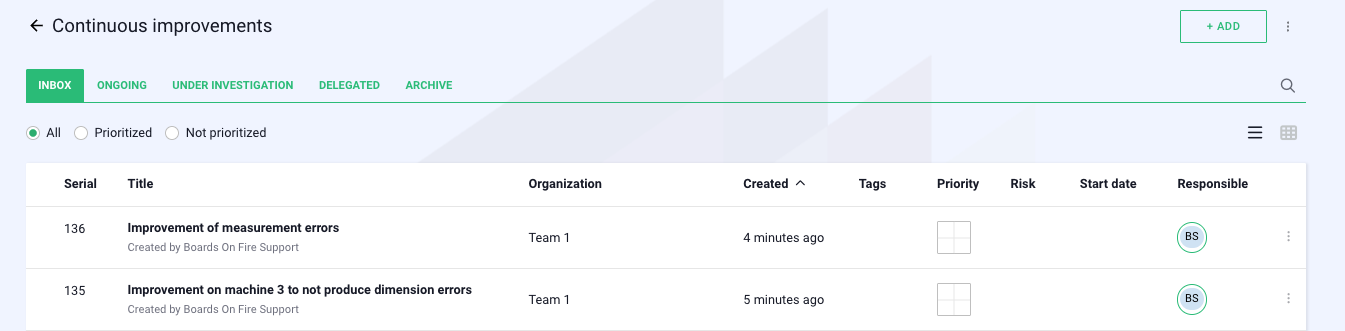
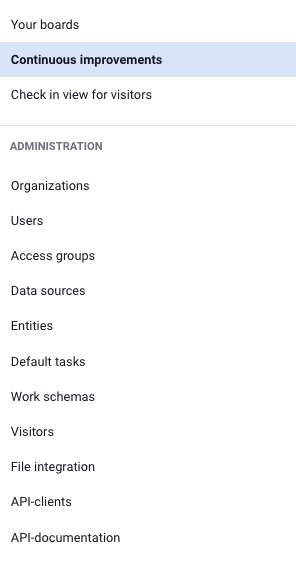
You can find the ‘Continuous Improvements’ module in the menu, which is the three white lines at the top left.
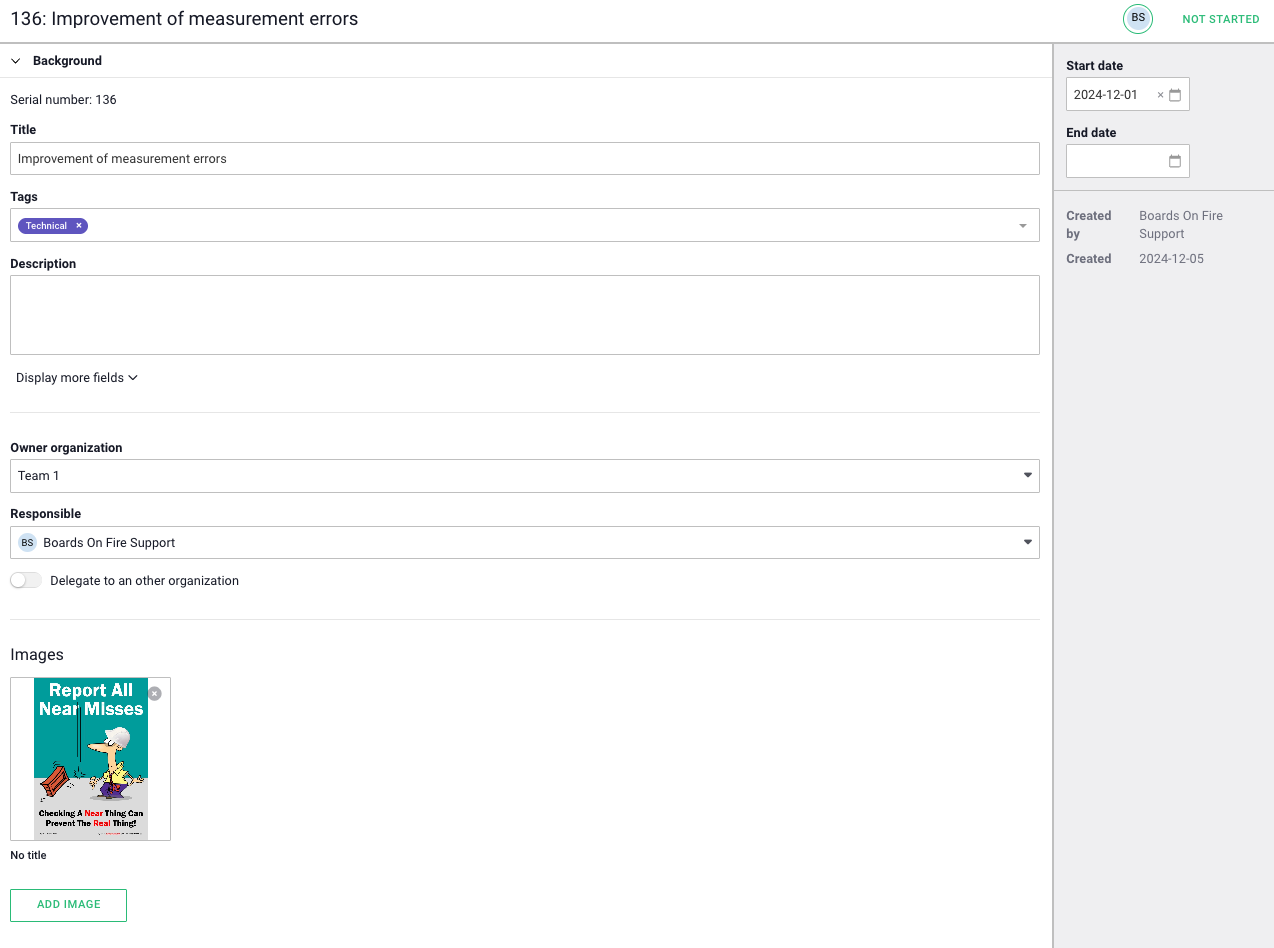
When you open a specific improvement, you can continue working on it using various methods, including PDCA, quickfix, or by choosing not to implement the improvement. There is also a grid where the improvement can be assessed based on effort, impact, and risk.
The image below shows an example of an improvement in the ‘Continuous Improvements’ module in Boards on Fire. In addition to what is shown in the image, the module also supports different working methods, such as PDCA (Plan-Do-Check-Act) and quickfix, which allows you to tailor the work based on the scope and needs of the improvement.
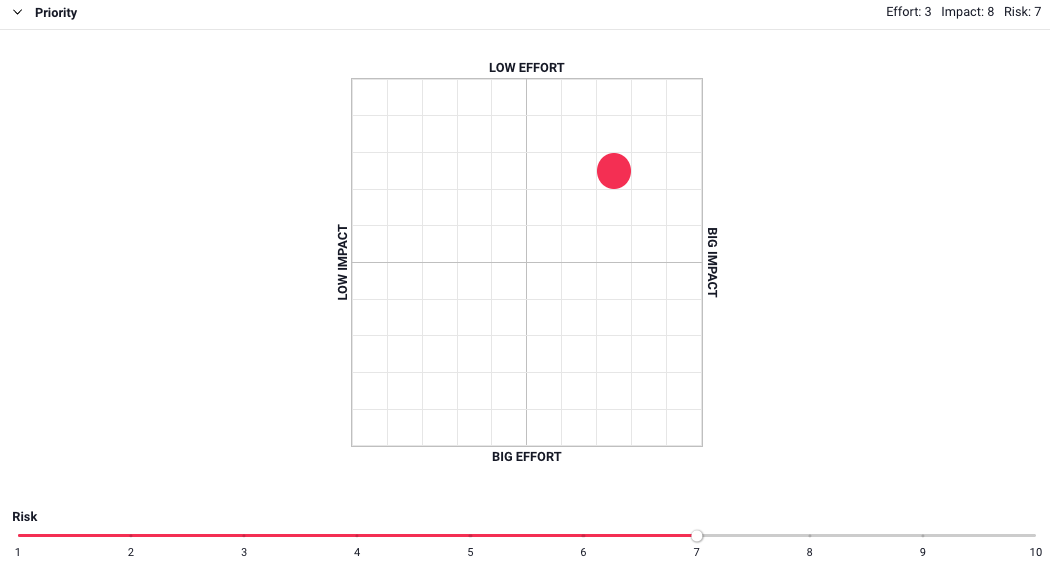
When working on an improvement, there is also a prioritization tool that visualizes improvement suggestions in a grid based on three factors: effort, impact, and risk. This tool helps teams make informed decisions about which improvements should be prioritized by weighing effort and impact against each other. By also including risk, you can ensure that critical improvements are not overlooked. You determine the priority in the grid by simply clicking on the box that best corresponds to your assessment of the improvement. To indicate the risk, you slide the slider to the number that best represents your evaluation.
On the ‘Classification’ tab, you choose whether the improvement should be handled as a quickfix or through the PDCA method. If you select the ‘Quickfix’ option, you will have the opportunity to add tasks to quickly address the improvement.
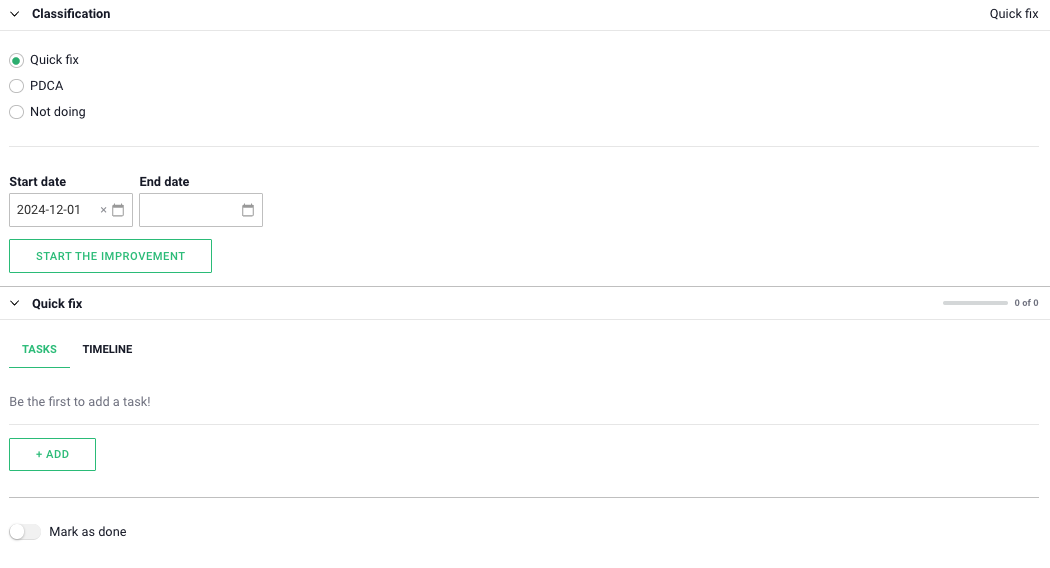
In the tasks, you can choose who is responsible, set start and end dates, and mark whether the task has been started or completed.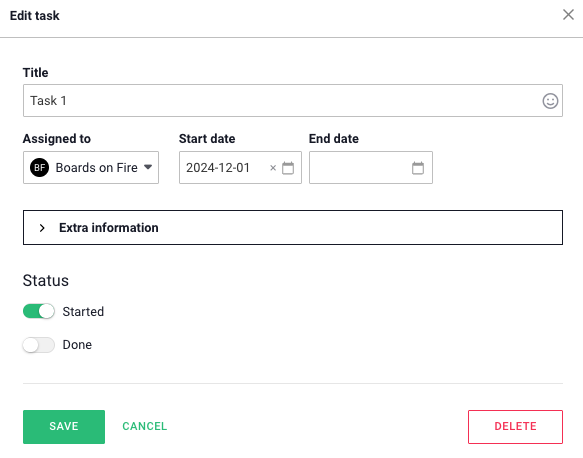
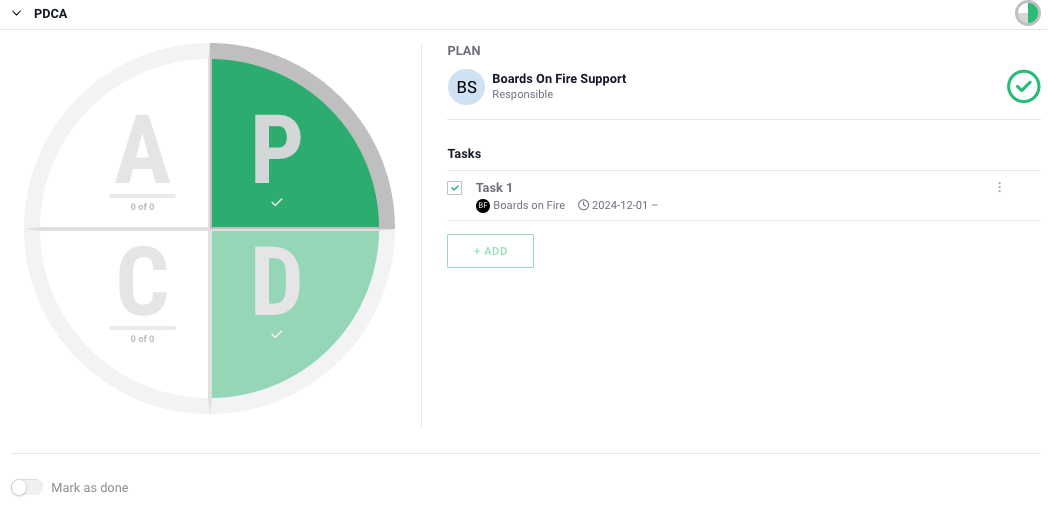
Furthermore, you will find the PDCA cycle, which provides a clear structure and ensures that the improvement is carefully planned and evaluated before implementation. With this tool, teams can visualize progress, assign responsibility, and manage tasks in an organized way. There is also the option to add standard tasks, allowing you to create sets of tasks that can be reused, saving time by eliminating the need to add them each time. In the example below, the Plan (P) and phases are marked as completed, while other phases have tasks remaining that must be completed before the improvement can be marked as finished.
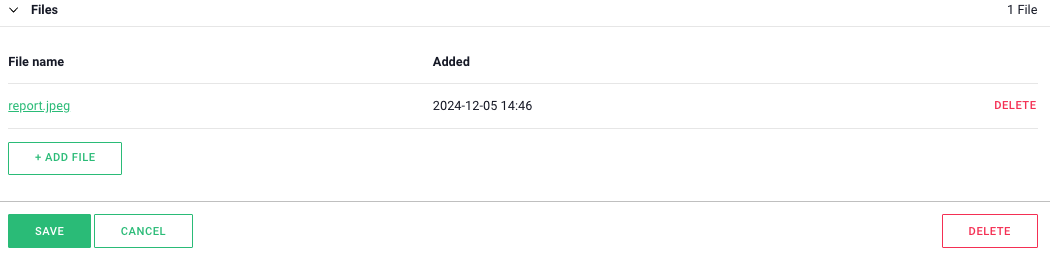
Finally, there is also support for adding files to an improvement. This can include PDFs, images, Excel files, or similar.
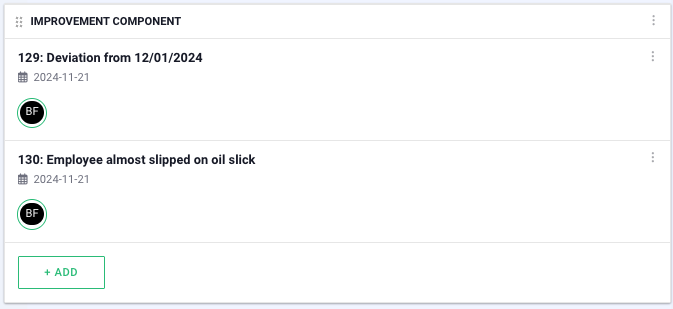
The continuous improvement component is used to both visualize and add the improvements that should be implemented in the workplace.
In the component settings, you can select which improvement stages you want to display, where the “active” option shows all improvements except the completed ones. In the organization settings, you can also choose which organizations’ improvements should be displayed.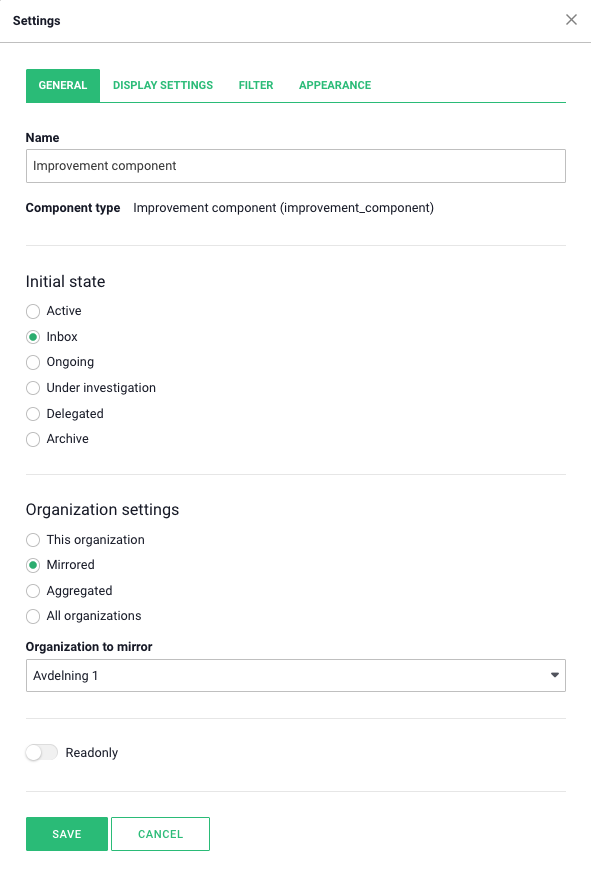
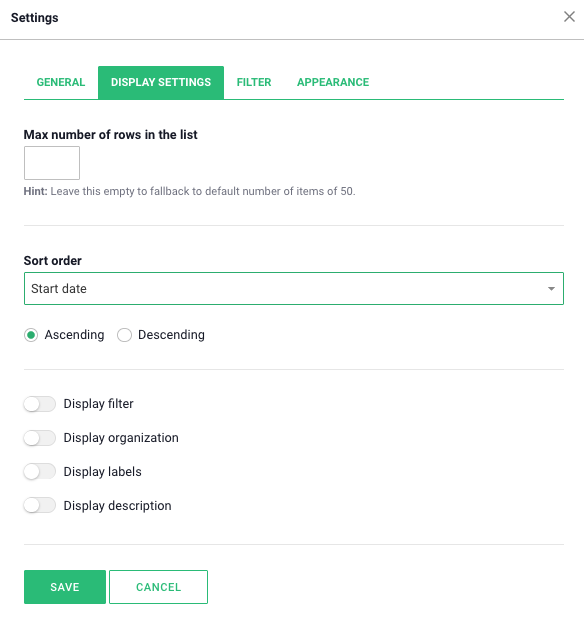
Under the display settings tab, you can set a maximum number of rows to be displayed. There is also an option to sort by different categories if desired, as well as to choose whether the sorting should be in ascending or descending order.
You can filter by specific labels under the “Filter” tab. Labels can only be created when adding a new improvement, meaning it is not possible to create new labels in the component’s settings.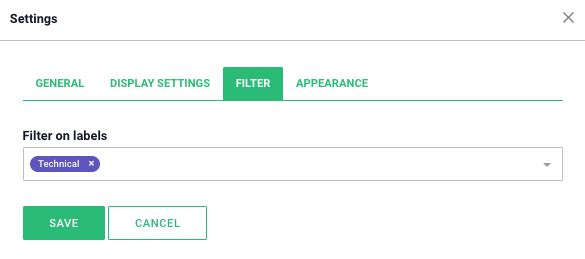
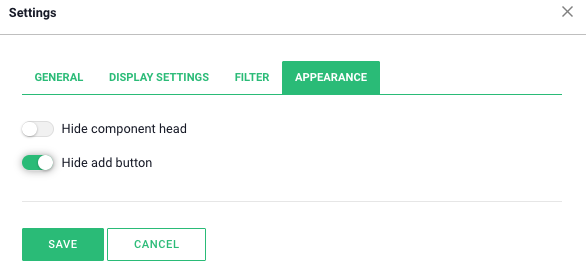
To hide the add button, preventing new improvements from being added, use the “hide add button” option under the appearance tab.
By using statistics on your improvements, you can concretely measure successes, identify areas for improvement, and track results over time.
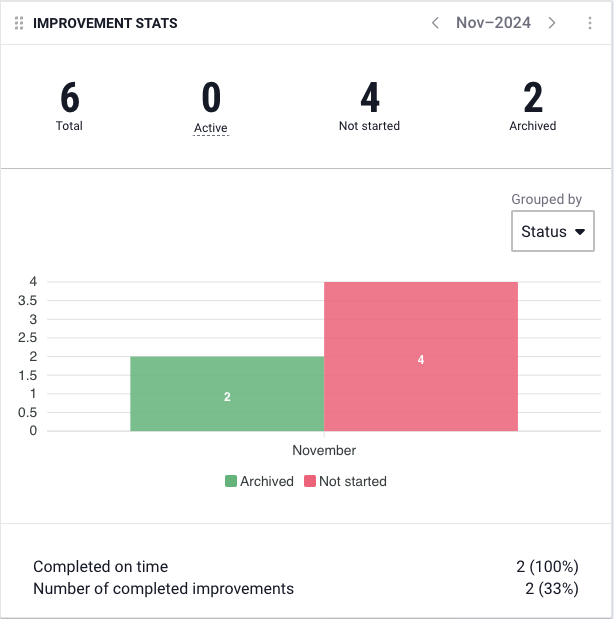
In the Improvement Statistics component, you can choose to group by different types of categories.
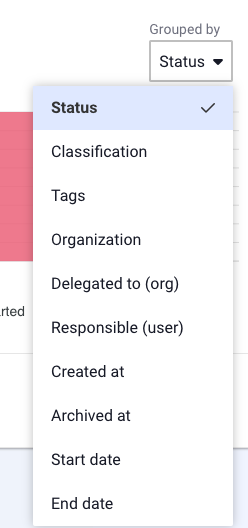
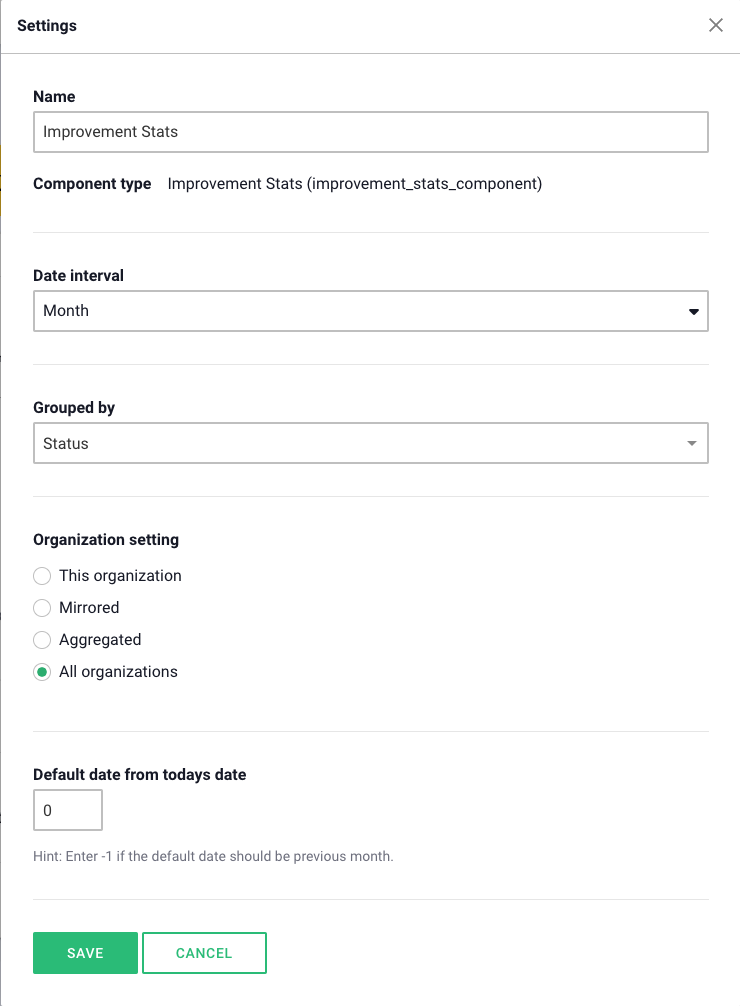
In the component settings, you can select the date range to display, with options for day, week, month, quarter, and year. Here, you can also specify how you want to group the improvements.
Free web demo