
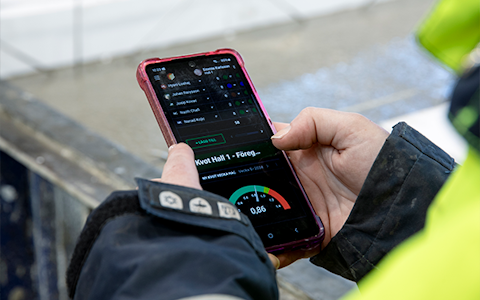
Digital dashboards that help you identify deviations and make the right decisions.

Capture your deviations and turn them into improvements
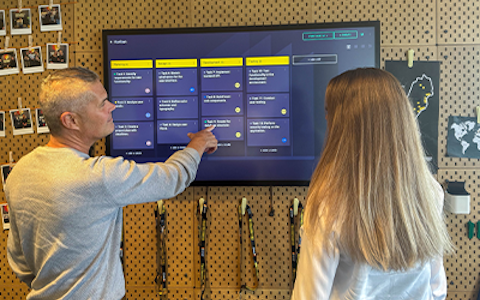
Continuous improvement, Kaizen boards, PDCA and other tools.
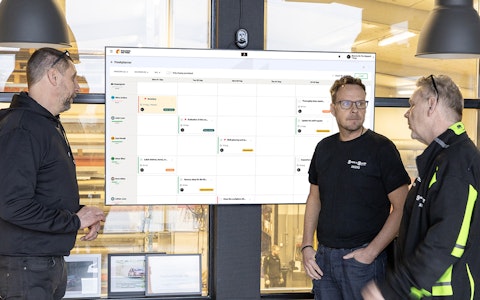
All your team’s tasks, neatly organized in one weekly view.
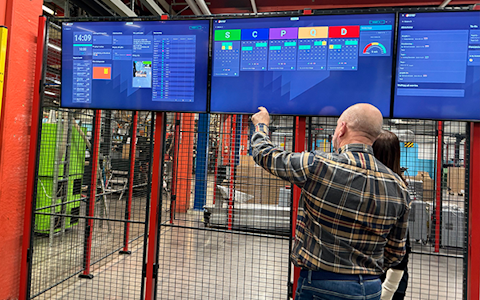
Improve key performance indicators within your specific focus areas with our SQCDP board.

Use the PDCA cycle as a tool to improve both quality and processes
Digital tools for 5S work, recurring audits, and a well-organized workplace.
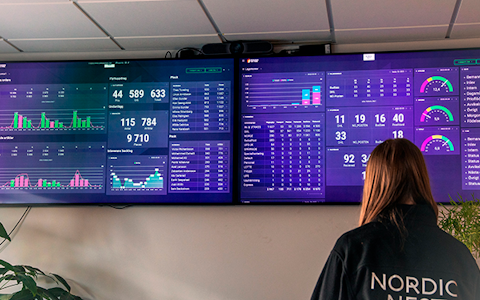
Visualize KPIs and communicate effectively throughout the entire organization.

Basic project management and activity boards.
Kanban is a powerful method for visualizing, managing, and optimizing workflows.

Digital dashboards for takt time flow with takt time counter and stop time log.
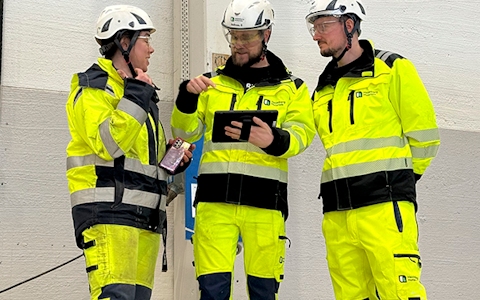
Digital visitor registration provides full control over all planned and executed visits to your business.
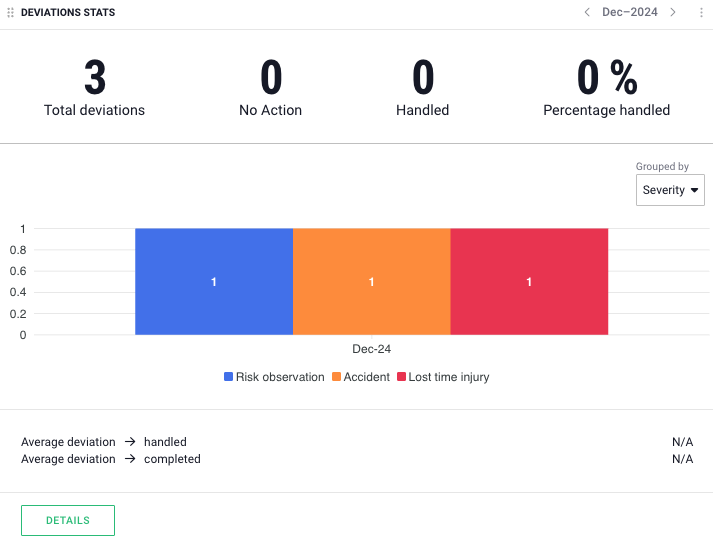
Deviation statistics in Boards on Fire is a powerful tool for analyzing and tracking registered deviations over time. With clear and detailed statistics, you can identify patterns, trends, and potential areas for improvement in your processes.
Using deviation statistics, you can easily identify recurring issues, track the progress of corrective actions, and measure their effectiveness. The overview view provides a summary of key metrics, such as the number of registered deviations, the most common types of deviations, severity distribution, and deviations per organization or department. With filtering options, you can further refine your analysis and break down the statistics based on deviation type, severity level, responsible person, or status.
The statistics are not just a tool for understanding what has happened but also a foundation for making better decisions moving forward. By regularly analyzing the data, you can proactively address recurring issues, follow up on the effectiveness of corrective actions, and ensure that resources are allocated effectively.
By integrating deviation statistics in Boards on Fire as a key part of your improvement efforts, you can create a more structured, proactive, and quality-focused organization.
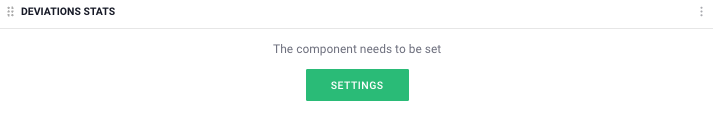
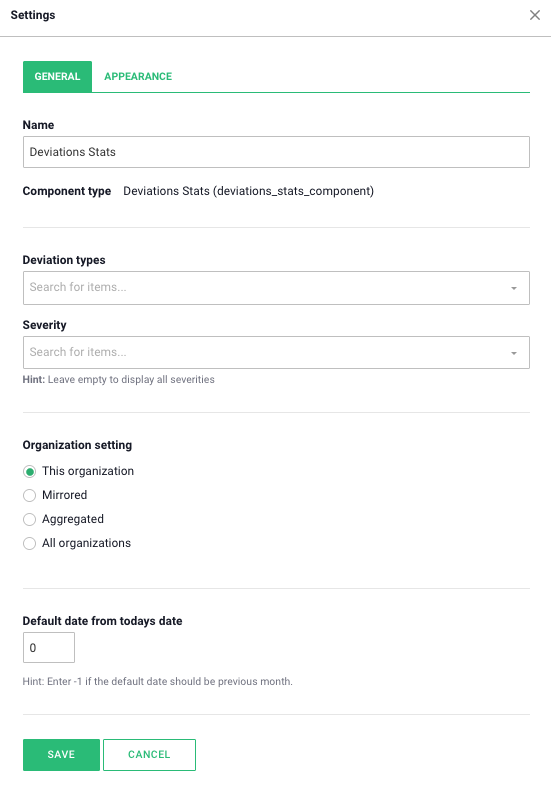
You can add a Deviation Statistics component by clicking the “Add” button in the top-right corner of an overview board and then selecting “Deviation Statistics” from the list.
In your board, it will then appear as shown below. Click on “Settings”.
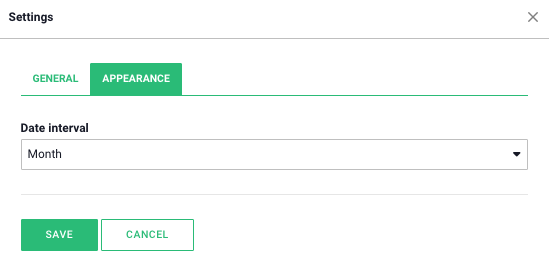
Under the “Appearance” tab, you can adjust the date range in the component.
Once the component is configured, you can also choose how the data should be sorted using the dropdown list in the component.
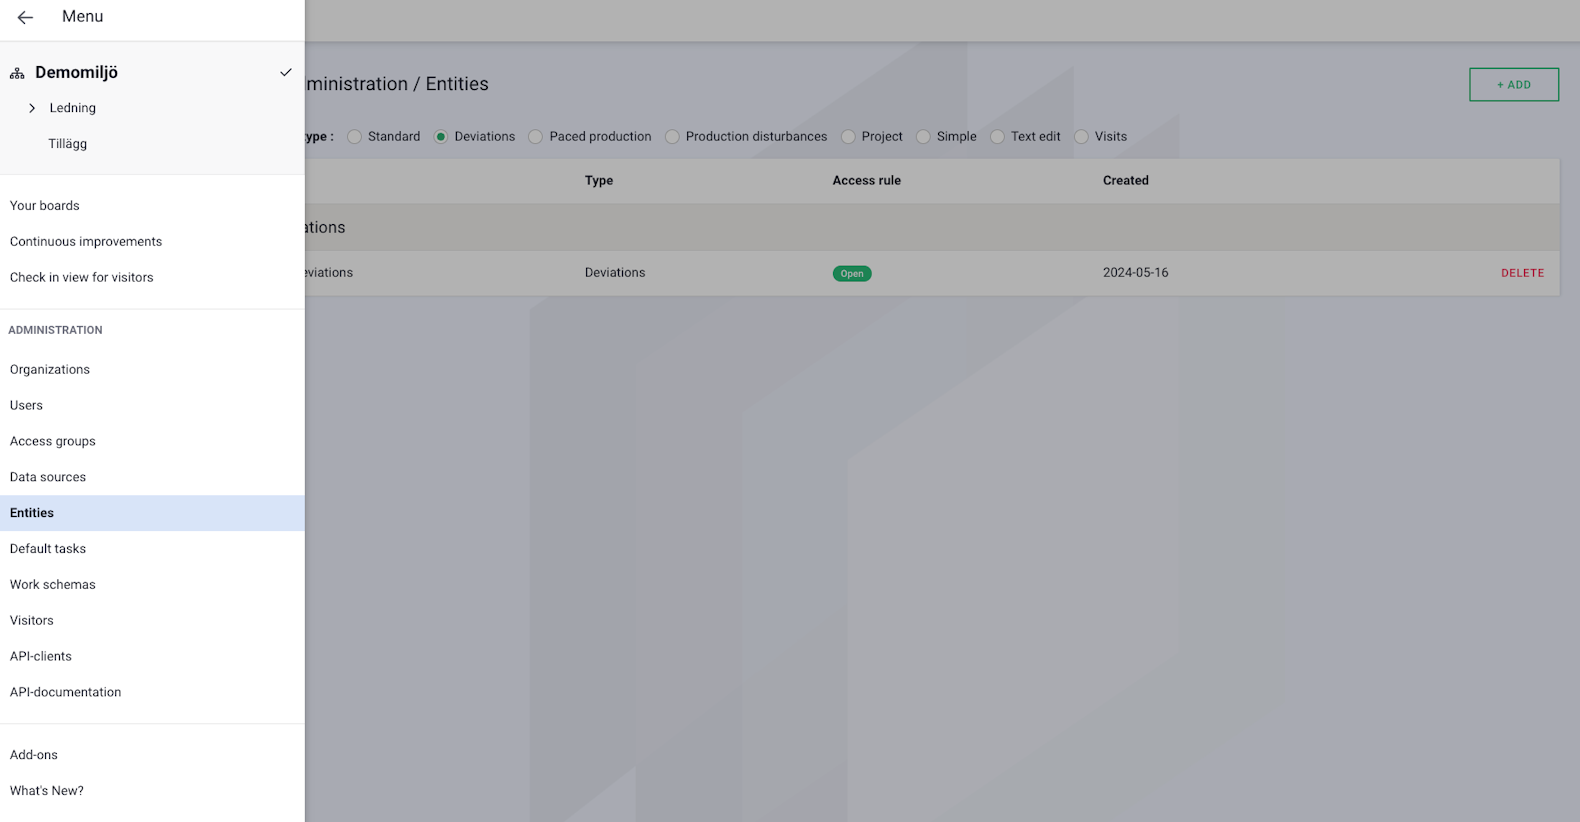
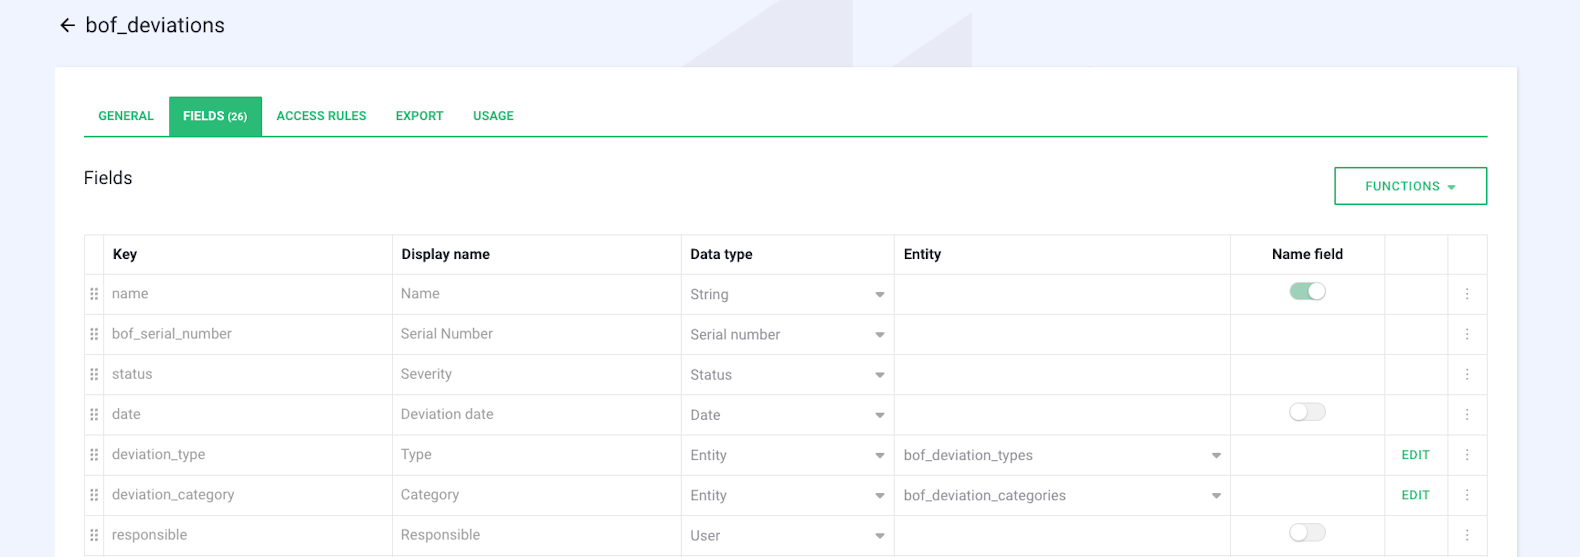
Navigate to the deviation entity as shown in the image below by:
Side Menu → Entities → Deviations → bof_deviations.
Here, you can manage the types and categories of deviations according to your needs.
Then go to the “Fields” tab and click “Edit” to the right of the “deviation_types” field.
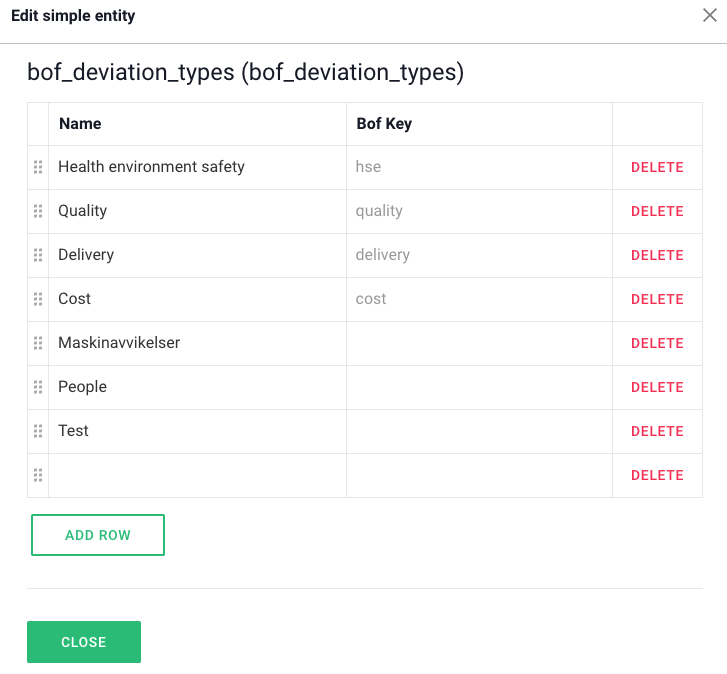
You can now edit the list of deviation types:
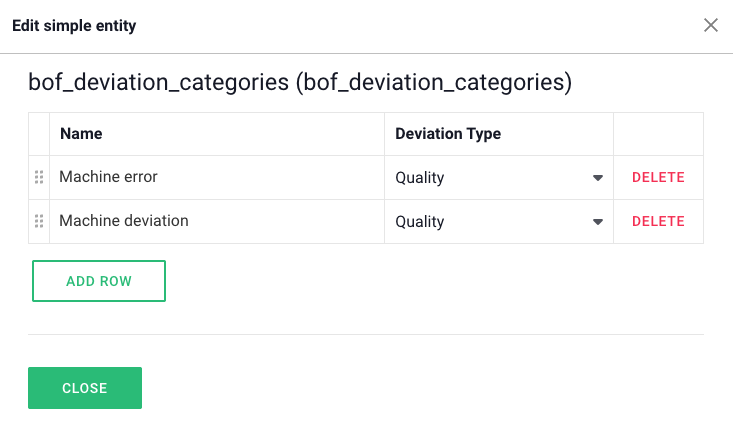
If you want to add new subcategories, click “Edit” to the right of the “deviation_category” field. In the box, choose a name for the subcategory and specify which deviation type it belongs to.
There are many smart add-on features in Boards on Fire. As a logged-in user, you can find a list of them all under Add-ons in the left-hand menu!
There are many smart add-on features in Boards on Fire. As a logged-in user, you can find a list of them all under Add-ons in the left-hand menu!
Free web demo