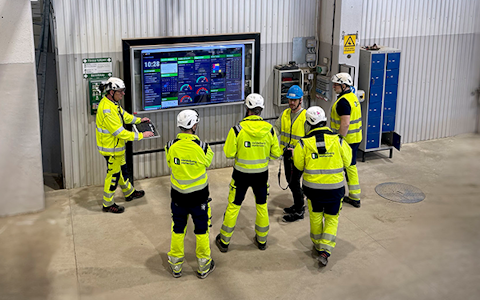
Digital dashboards that help you identify deviations and make the right decisions.

Capture your deviations and turn them into improvements
Continuous improvement, Kaizen boards, PDCA and other tools.
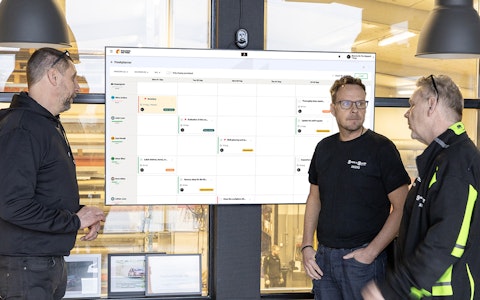
All your team’s tasks, neatly organized in one weekly view.
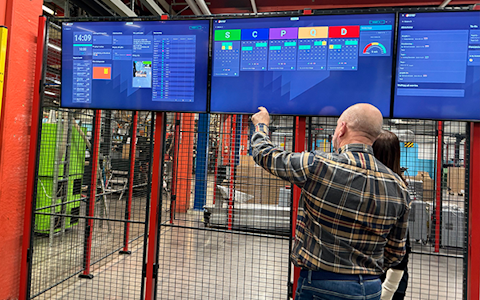
Improve key performance indicators within your specific focus areas with our SQCDP board.

Use the PDCA cycle as a tool to improve both quality and processes
Digital tools for 5S work, recurring audits, and a well-organized workplace.
Visualize KPIs and communicate effectively throughout the entire organization.

Basic project management and activity boards.
Kanban is a powerful method for visualizing, managing, and optimizing workflows.

Digital dashboards for takt time flow with takt time counter and stop time log.
Digital visitor registration provides full control over all planned and executed visits to your business.
The status component is a calendar in month view that provides an intuitive way to record and track deviations in areas such as quality, delivery, and production.
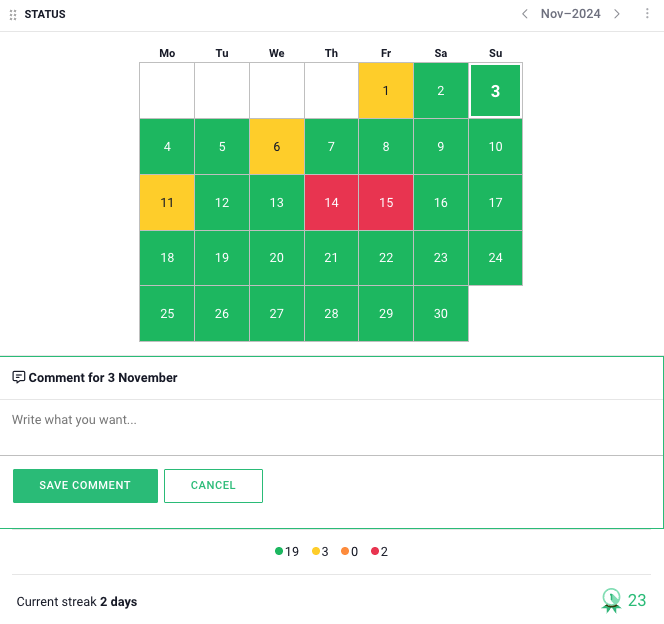
• Monthly View: Provides a clear overview of daily deviations across an entire month.
• Customizable Logging: Enables the registration of various types of deviations across different areas.
• Visualization: With clear color codes, users can quickly identify days with reported deviations.
Examples of Use Cases:
• Quality: Track and log product quality deviations.
• Delivery: Monitor delays or issues with deliveries.
• Production: Identify and document production disruptions.
To log the status of a specific day, click on the desired date in the calendar. Upon doing so, a color selection will appear, allowing you to choose from four colors: green, yellow, orange, and red. Each color represents a specific status—for example, green for a day with no deviations and red for a day with serious issues. You can rename these statuses to fit your organization’s specific workflow, as explained in the “Status Configuration” section. Select the color that best reflects the day’s events to log it accurately.
In the status component, you can also create both deviations and improvement actions. For more information on working with deviation management and improvement efforts in Boards on Fire, refer to the related articles.
This component requires a data source. The only field that needs to be created in this data source is a field with the data type “status”. Once you have created the data source, go to the component settings, which can be found by clicking the three dots in the top-right corner.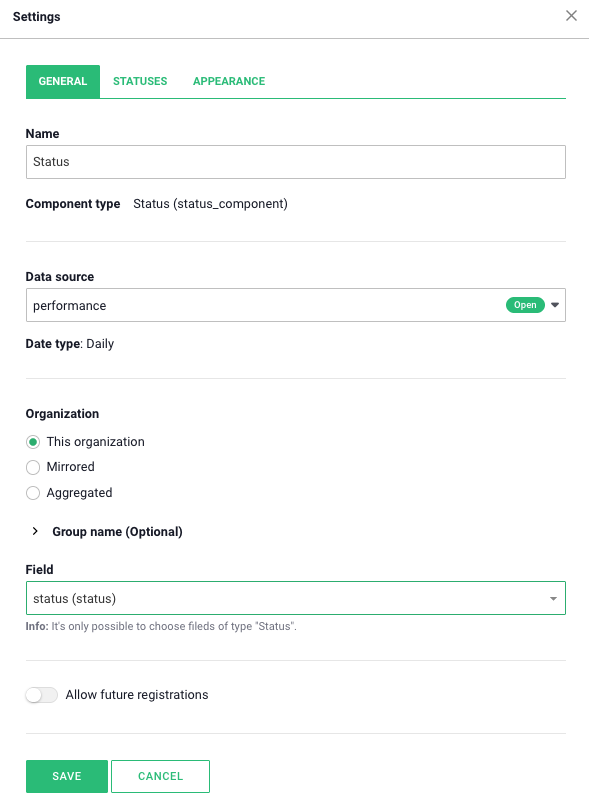
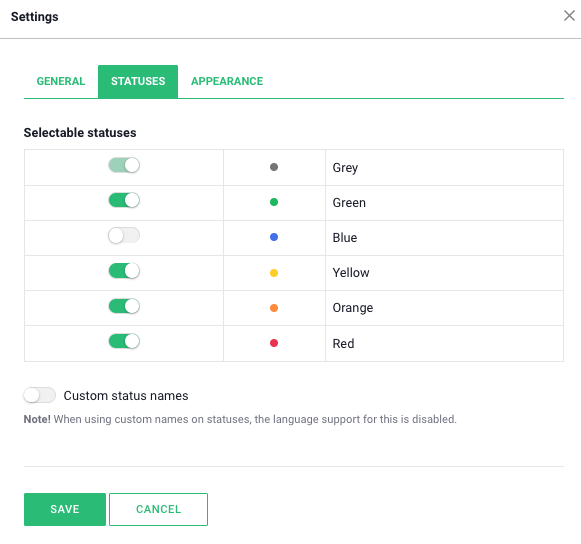
In the settings for this component, you can assign custom names to the colors and exclude them if needed. These settings are under the “Statuses” section. To customize the status names, activate the “Custom status names” button and then enter the desired name in the box where the current name is displayed. To hide or show specific colors, click the button next to each color.
Den sista rubriken för inställningar i statuskomponenten är "Utseende".
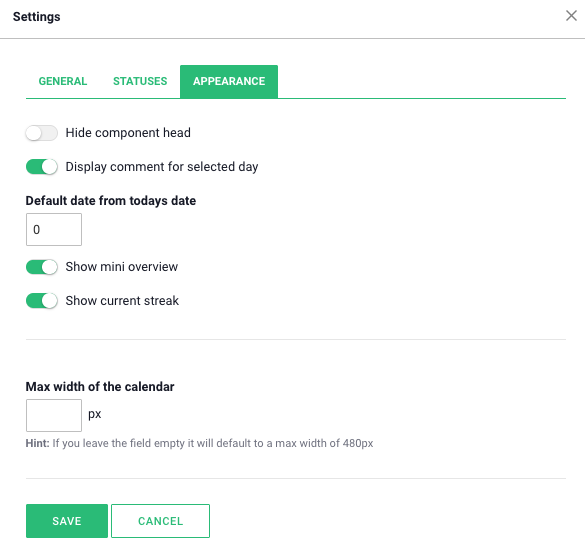
Here you can enable various display options to customize how information is presented in the calendar. By turning on “Show comments for selected day”, you can view the comments added for specific days. To display the number of days logged in each color during the month, enable the “Show mini overview” option. You can also activate a streak function, which shows how many consecutive days have passed without a red day, by selecting “Show current streak”.
There are many smart add-on features in Boards on Fire. As a logged-in user, you can find a list of them all under Add-ons in the left-hand menu!
There are many smart add-on features in Boards on Fire. As a logged-in user, you can find a list of them all under Add-ons in the left-hand menu!
Free web demo