
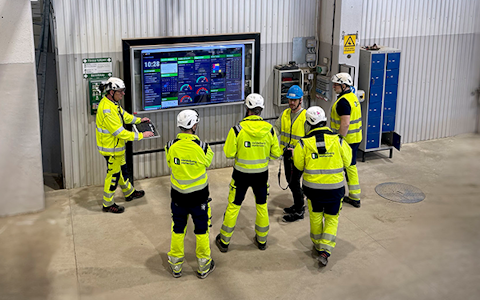
Digital dashboards that help you identify deviations and make the right decisions.
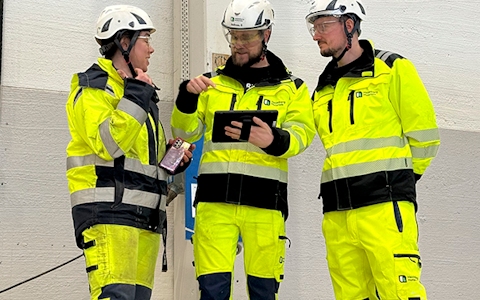
Continuous improvement, Kaizen boards, PDCA and other tools.
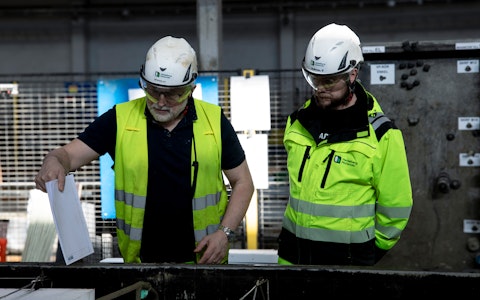
Capture your deviations and turn them into improvements

Real-time control for takt-based production. Detect disruptions as they happen, respond faster, and keep production on pace.

Integrate Boards on Fire with ERP, MES, OEE, Power BI and other systems. Automate data flows, reduce administration and act faster.
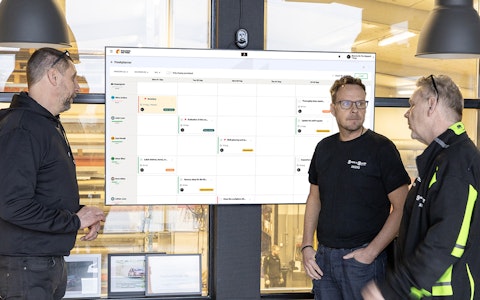
All your team’s tasks, neatly organized in one weekly view.
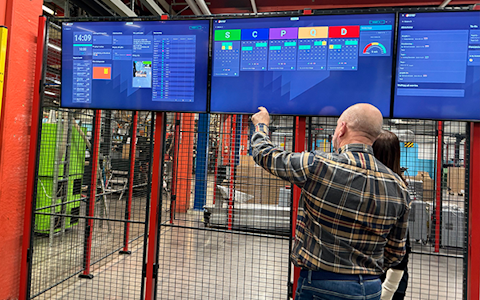
Improve key performance indicators within your specific focus areas with our SQCDP board.
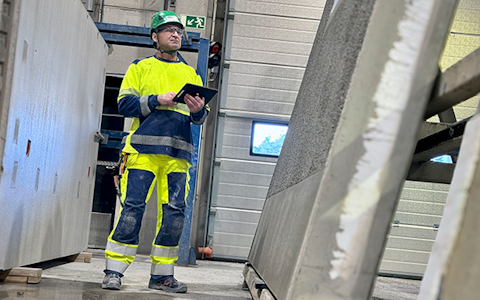
Use the PDCA cycle as a tool to improve both quality and processes
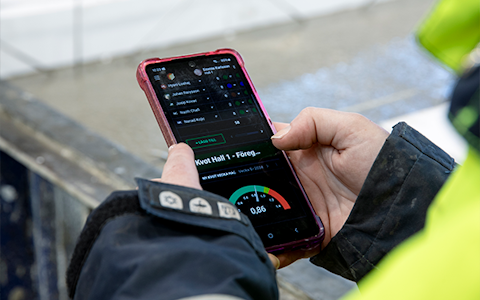
Digital tools for 5S work, recurring audits, and a well-organized workplace.
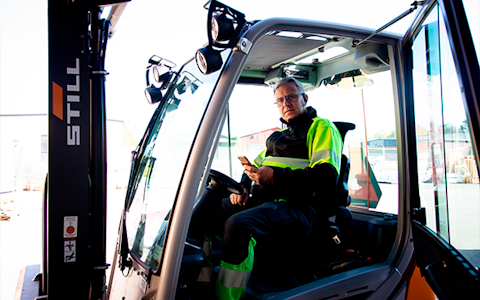
Basic project management and activity boards.
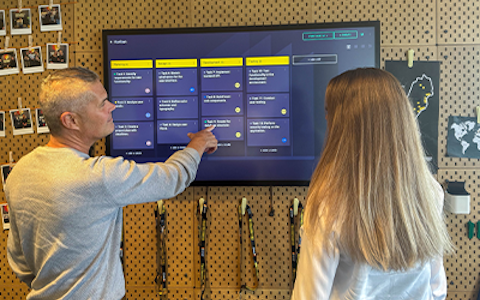
Kanban is a powerful method for visualizing, managing, and optimizing workflows.
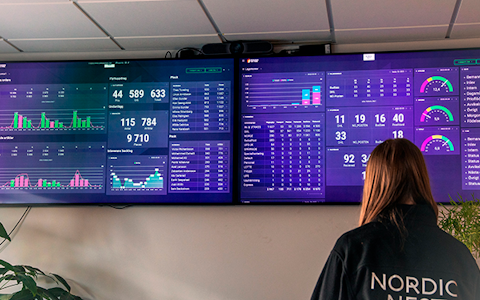
Visualize KPIs and communicate effectively throughout the entire organization.
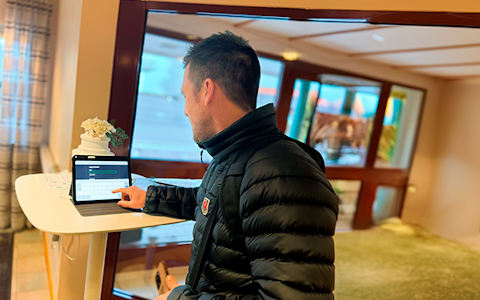
Digital visitor registration provides full control over all planned and executed visits to your business.
Working with continuous improvements fosters a culture of development and quality within the organization. By using statistics, you can concretely measure successes, identify areas for improvement, and track results over time. The statistics make improvement efforts more transparent, facilitating decision-making and resource prioritization. Additionally, it enables you to visualize progress and engage employees in the work towards shared goals.
By using statistics on your improvements, you can concretely measure successes, identify areas for improvement, and track results over time.
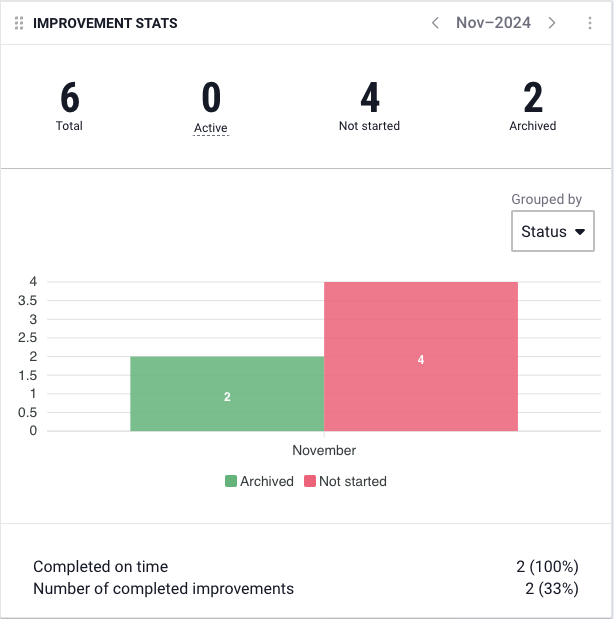
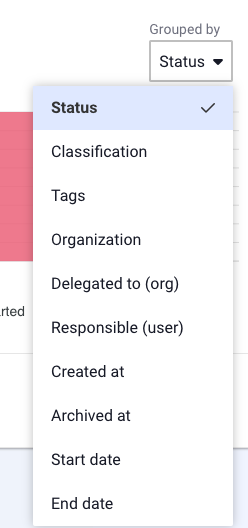
In the Improvement Statistics component, you can choose to group by different types of categories.
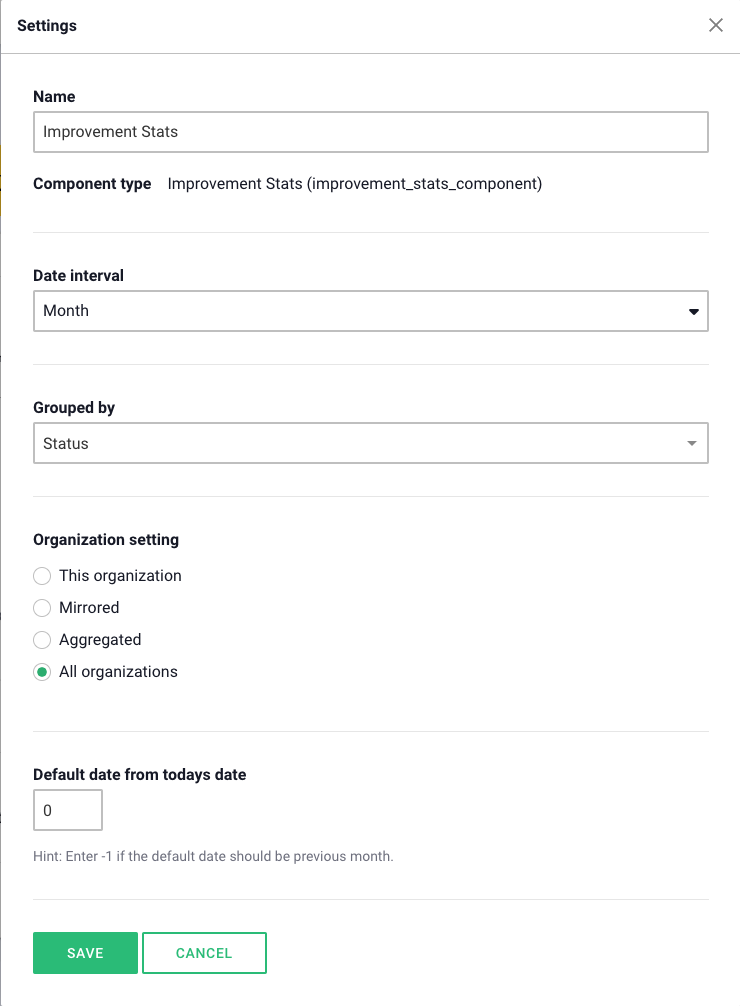
In the component settings, you can select the date range to display, with options for day, week, month, quarter, and year. Here, you can also specify how you want to group the improvements.
Free web demo