
Digital dashboards that help you identify deviations and make the right decisions.

Capture your deviations and turn them into improvements

Continuous improvement, Kaizen boards, PDCA and other tools.
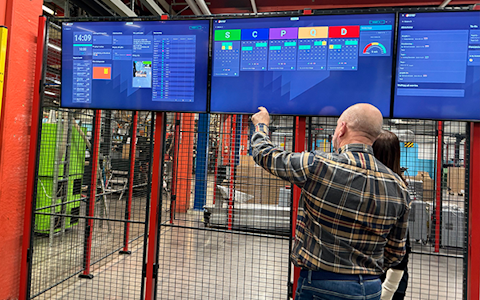
Improve key performance indicators within your specific focus areas with our SQCDP board.

Use the PDCA cycle as a tool to improve both quality and processes
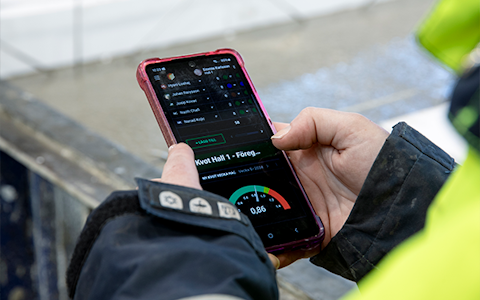
Digital tools for 5S work, recurring audits, and a well-organized workplace.
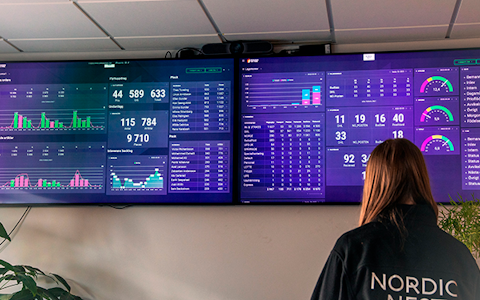
Visualize KPIs and communicate effectively throughout the entire organization.

Basic project management and activity boards.

Digital dashboards for takt time flow with takt time counter and stop time log.

Digital visitor registration provides full control over all planned and executed visits to your business.
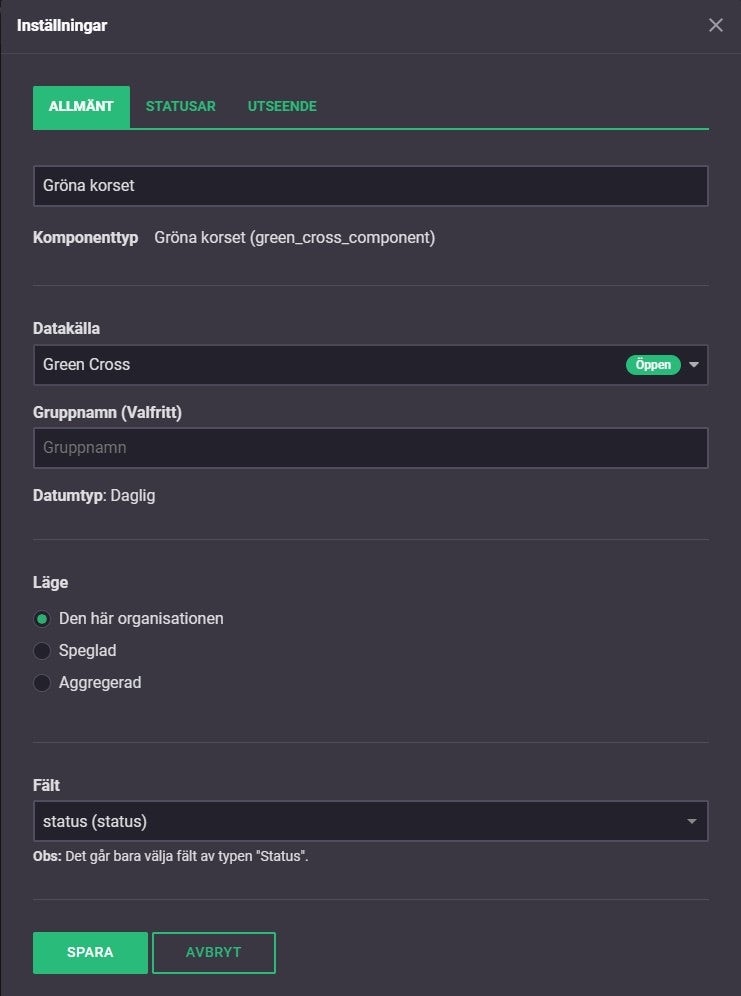
The data source for the Green Cross is already pre-configured, so there’s no need to set it up manually. Additionally, a status field is automatically selected, as only fields with the “status” data type can be used. All you need to do is access the component’s settings and click “Save” – and voilà, the Green Cross is ready to use!
This component supports both aggregation and mirroring, and these settings can be adjusted under the "Mode" tab. For example, if you aggregate two boards into one management board, the most critical status will always be displayed in the Green Cross of the management board. So, if a sub-organization experiences an accident during the day, the management board will show red – even if all other sub-organizations have had an incident-free day. You can also configure the Green Cross to display data only for the organization where the component has been added. To do this, simply select "This organization."
Links to:
In the component settings, you can name the colors with custom names and exclude colors if desired. There are also default naming options available if you prefer to use those. You can find the settings to rename colors under the “Statuses” section. To rename a status, activate the "Custom status names" button, then type the desired name in the box where the current name is displayed. To hide or activate the colors shown, click the button displayed next to each color.
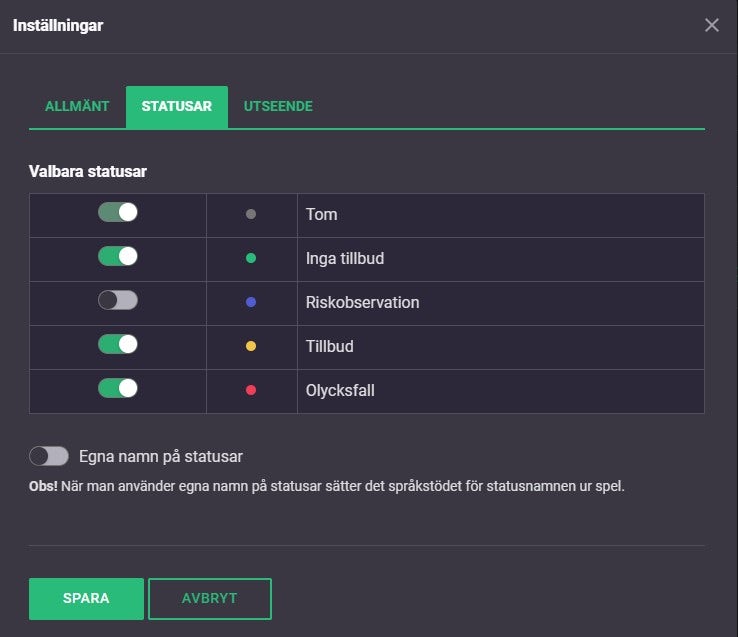
The default meanings for the different colors are as follows:
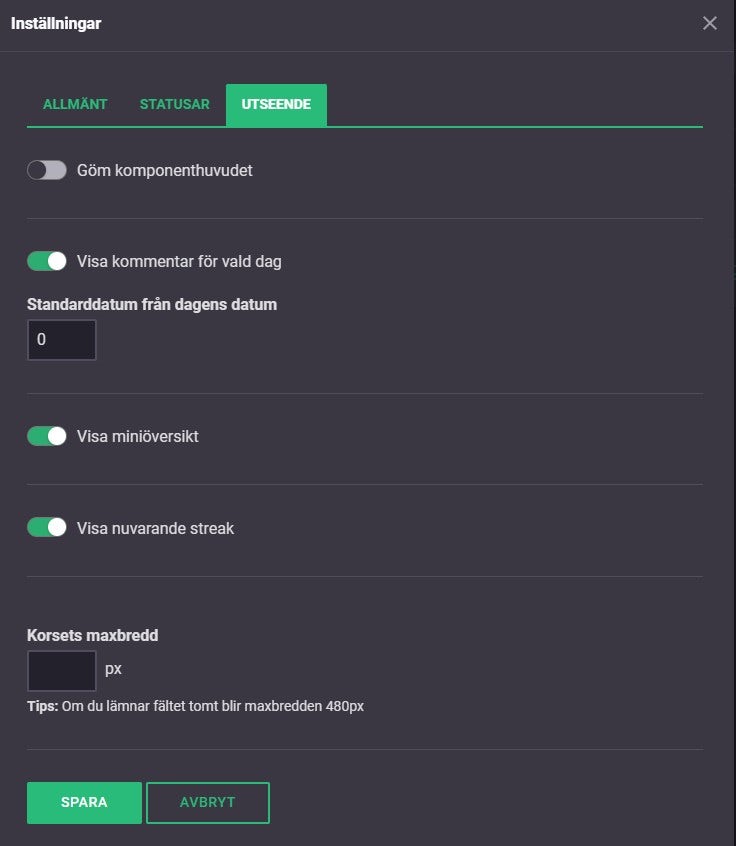
You can enable the display of comments added to specific days by activating “Show comments for selected day.” To display the number of days logged for each color during the month, activate “Show mini-overview.” You can also enable a streak counter, showing how many consecutive days have passed without a red day, by clicking “Show current streak.”
The Green Cross is also available in a format that displays the entire year, divided month by month. To access this view, go to the component settings and select “Yearly Overview.”
You can also view a layout that presents the statuses logged each day, month by month.
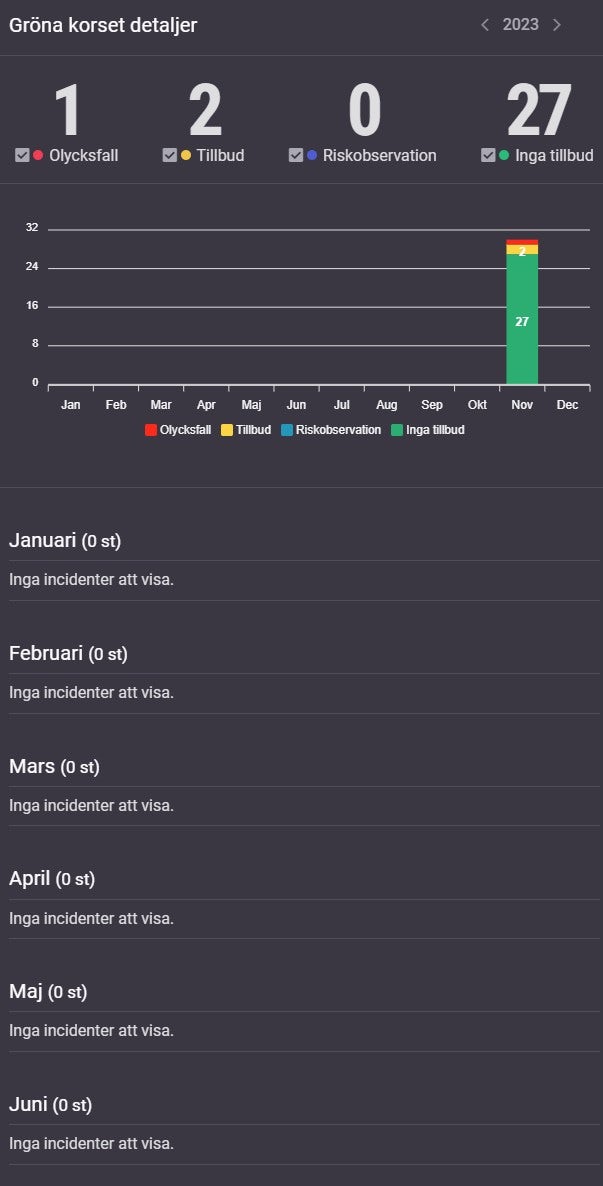
- Lägg in ny bild (obs gammal bild ovan)
Free web demo